ZynexInc ZYXI full analysis,charts,indicators,moving averages,SMA,DMA,EMA,ADX,MACD,RSIZynex Inc ZYXI WideScreen charts, DMA,SMA,EMA technical analysis, forecast prediction, by indicators ADX,MACD,RSI,CCI USA stock exchange
operates under Health Care sector & deals in Biotechnology Electromedical Electrotherapeutic Apparatus
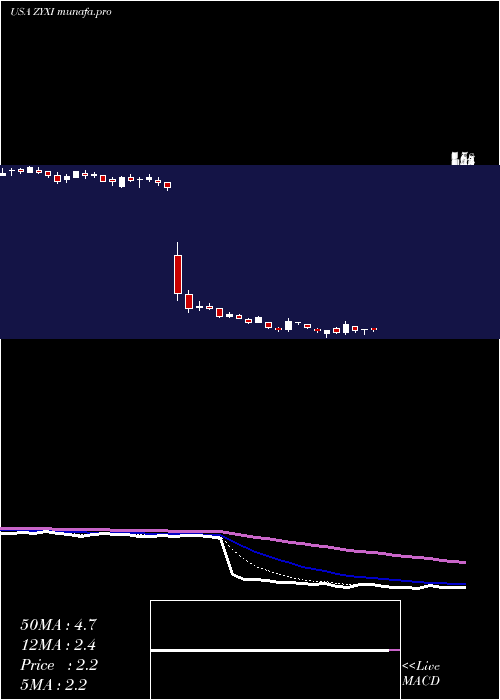
Daily price and charts and targets ZynexInc Strong Daily Stock price targets for ZynexInc ZYXI are 0.49 and 0.81 | Daily Target 1 | 0.25 | | Daily Target 2 | 0.41 | | Daily Target 3 | 0.57333333333333 | | Daily Target 4 | 0.73 | | Daily Target 5 | 0.89 |
Daily price and volume Zynex Inc
| Date |
Closing |
Open |
Range |
Volume |
Wed 19 November 2025 |
0.56 (33.33%) |
0.46 |
0.42 - 0.74 |
9.4222 times |
Tue 18 November 2025 |
0.42 (-26.32%) |
0.57 |
0.38 - 0.59 |
0.182 times |
Mon 17 November 2025 |
0.57 (0%) |
0.61 |
0.52 - 0.64 |
0.0994 times |
Fri 14 November 2025 |
0.57 (-26.92%) |
0.77 |
0.51 - 0.78 |
0.1319 times |
Thu 13 November 2025 |
0.78 (-29.73%) |
1.06 |
0.73 - 1.06 |
0.1055 times |
Wed 12 November 2025 |
1.11 (-4.31%) |
1.16 |
1.10 - 1.20 |
0.0049 times |
Tue 11 November 2025 |
1.16 (-1.69%) |
1.16 |
1.10 - 1.19 |
0.0063 times |
Mon 10 November 2025 |
1.18 (13.46%) |
1.03 |
1.03 - 1.19 |
0.0172 times |
Fri 07 November 2025 |
1.04 (-0.95%) |
1.03 |
1.03 - 1.10 |
0.0125 times |
Thu 06 November 2025 |
1.05 (-7.08%) |
1.11 |
1.05 - 1.13 |
0.0181 times |
Wed 05 November 2025 |
1.13 (-0.88%) |
1.11 |
1.09 - 1.16 |
0.0055 times |
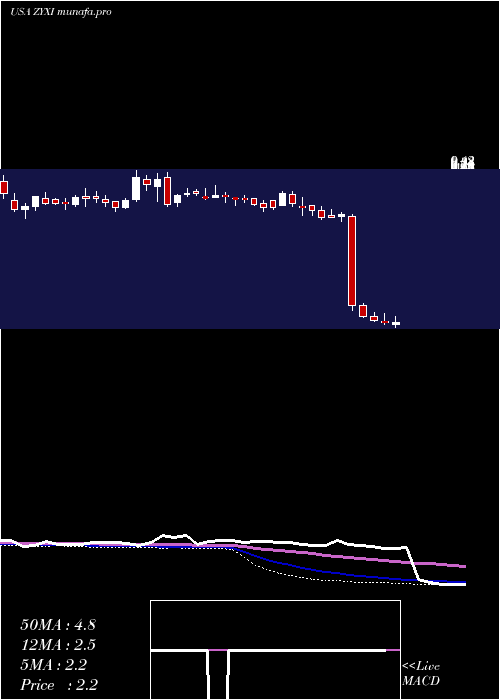
Weekly price and charts ZynexInc Strong weekly Stock price targets for ZynexInc ZYXI are 0.29 and 0.65 | Weekly Target 1 | 0.2 | | Weekly Target 2 | 0.38 | | Weekly Target 3 | 0.56 | | Weekly Target 4 | 0.74 | | Weekly Target 5 | 0.92 |
Weekly price and volumes for Zynex Inc
| Date |
Closing |
Open |
Range |
Volume |
Wed 19 November 2025 |
0.56 (-1.75%) |
0.61 |
0.38 - 0.74 |
9.4648 times |
Fri 14 November 2025 |
0.57 (-45.19%) |
1.03 |
0.51 - 1.20 |
0.2592 times |
Fri 07 November 2025 |
1.04 (-9.57%) |
1.13 |
1.03 - 1.19 |
0.0387 times |
Fri 31 October 2025 |
1.15 (0%) |
1.21 |
1.13 - 1.23 |
0.0148 times |
Fri 31 October 2025 |
1.15 (-17.86%) |
1.39 |
1.13 - 1.42 |
0.0449 times |
Fri 24 October 2025 |
1.40 (5.26%) |
1.34 |
1.32 - 1.47 |
0.0413 times |
Fri 17 October 2025 |
1.33 (-3.62%) |
1.41 |
1.30 - 1.43 |
0.0258 times |
Fri 10 October 2025 |
1.38 (-6.12%) |
1.45 |
1.35 - 1.52 |
0.0409 times |
Fri 03 October 2025 |
1.47 (1.38%) |
1.45 |
1.41 - 1.50 |
0.0296 times |
Fri 26 September 2025 |
1.45 (-6.45%) |
1.55 |
1.44 - 1.61 |
0.04 times |
Fri 19 September 2025 |
1.55 (4.73%) |
1.48 |
1.44 - 1.62 |
0.044 times |
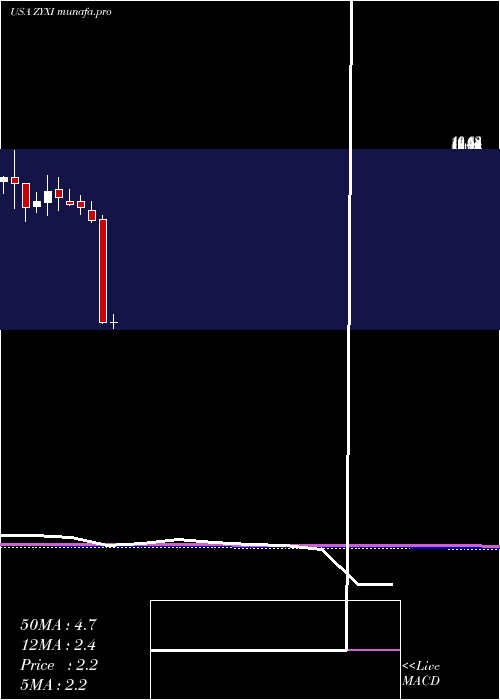
Monthly price and charts ZynexInc Strong monthly Stock price targets for ZynexInc ZYXI are 0.06 and 0.88 | Monthly Target 1 | -0.11 | | Monthly Target 2 | 0.23 | | Monthly Target 3 | 0.71333333333333 | | Monthly Target 4 | 1.05 | | Monthly Target 5 | 1.53 |
Monthly price and volumes Zynex Inc
| Date |
Closing |
Open |
Range |
Volume |
Wed 19 November 2025 |
0.56 (-51.3%) |
1.13 |
0.38 - 1.20 |
7.3435 times |
Fri 31 October 2025 |
1.15 (-20.69%) |
1.42 |
1.13 - 1.52 |
0.1372 times |
Tue 30 September 2025 |
1.45 (-11.59%) |
1.61 |
1.41 - 1.68 |
0.1385 times |
Fri 29 August 2025 |
1.64 (-26.46%) |
2.11 |
1.23 - 2.11 |
0.3932 times |
Thu 31 July 2025 |
2.23 (-13.57%) |
2.58 |
2.05 - 2.82 |
0.2068 times |
Mon 30 June 2025 |
2.58 (10.26%) |
2.35 |
1.99 - 2.82 |
0.3904 times |
Fri 30 May 2025 |
2.34 (40.96%) |
1.75 |
1.70 - 2.66 |
0.277 times |
Wed 30 April 2025 |
1.66 (-24.55%) |
2.18 |
1.66 - 2.58 |
0.3398 times |
Mon 31 March 2025 |
2.20 (-69.49%) |
7.26 |
2.14 - 7.43 |
0.6666 times |
Fri 28 February 2025 |
7.21 (-8.04%) |
7.72 |
7.12 - 8.13 |
0.1069 times |
Fri 31 January 2025 |
7.84 (-2.12%) |
8.12 |
7.50 - 8.45 |
0.0874 times |
DMA SMA EMA moving averages of Zynex Inc ZYXI
DMA (daily moving average) of Zynex Inc ZYXI
| DMA period | DMA value | | 5 day DMA | 0.58 | | 12 day DMA | 0.89 | | 20 day DMA | 1.05 | | 35 day DMA | 1.2 | | 50 day DMA | 1.29 | | 100 day DMA | 1.61 | | 150 day DMA | 1.83 | | 200 day DMA | 2.63 | EMA (exponential moving average) of Zynex Inc ZYXI
| EMA period | EMA current | EMA prev | EMA prev2 | | 5 day EMA | 0.62 | 0.65 | 0.76 | | 12 day EMA | 0.84 | 0.89 | 0.97 | | 20 day EMA | 0.98 | 1.02 | 1.08 | | 35 day EMA | 1.12 | 1.15 | 1.19 | | 50 day EMA | 1.24 | 1.27 | 1.3 |
SMA (simple moving average) of Zynex Inc ZYXI
| SMA period | SMA current | SMA prev | SMA prev2 | | 5 day SMA | 0.58 | 0.69 | 0.84 | | 12 day SMA | 0.89 | 0.94 | 1 | | 20 day SMA | 1.05 | 1.09 | 1.14 | | 35 day SMA | 1.2 | 1.23 | 1.26 | | 50 day SMA | 1.29 | 1.31 | 1.33 | | 100 day SMA | 1.61 | 1.63 | 1.65 | | 150 day SMA | 1.83 | 1.84 | 1.85 | | 200 day SMA | 2.63 | 2.67 | 2.71 |
|
|
