WatscoInc WSO.B full analysis,charts,indicators,moving averages,SMA,DMA,EMA,ADX,MACD,RSIWatsco Inc WSO.B WideScreen charts, DMA,SMA,EMA technical analysis, forecast prediction, by indicators ADX,MACD,RSI,CCI USA stock exchange
operates under N A sector & deals in N A
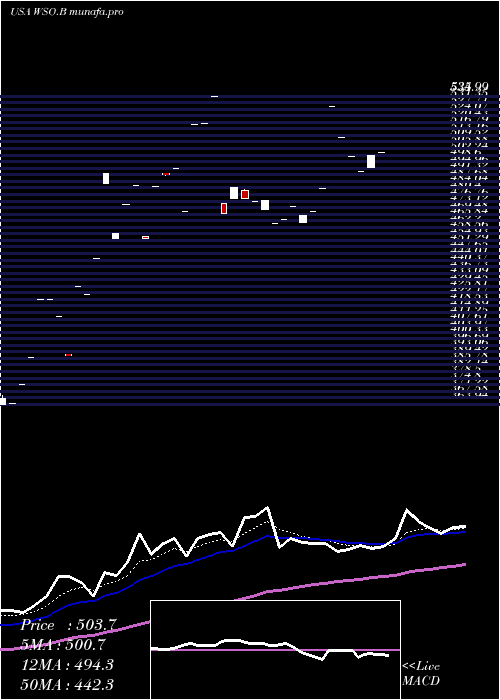
Daily price and charts and targets WatscoInc Strong Daily Stock price targets for WatscoInc WSO.B are 503.71 and 503.71 | Daily Target 1 | 503.71 | | Daily Target 2 | 503.71 | | Daily Target 3 | 503.71 | | Daily Target 4 | 503.71 | | Daily Target 5 | 503.71 |
Daily price and volume Watsco Inc
| Date |
Closing |
Open |
Range |
Volume |
Tue 11 March 2025 |
503.71 (0.37%) |
503.71 |
503.71 - 503.71 |
0.3861 times |
Wed 05 March 2025 |
501.84 (1.79%) |
495.32 |
495.32 - 502.15 |
2.278 times |
Mon 03 March 2025 |
493.00 (-1.67%) |
492.95 |
492.95 - 493.00 |
0.7722 times |
Mon 24 February 2025 |
501.35 (-2.06%) |
501.35 |
501.35 - 501.35 |
0.9653 times |
Wed 19 February 2025 |
511.89 (-3.32%) |
511.89 |
511.89 - 511.89 |
1.5444 times |
Tue 18 February 2025 |
529.46 (9.44%) |
529.46 |
529.46 - 529.46 |
0.1931 times |
Fri 14 February 2025 |
483.79 (2.77%) |
483.79 |
483.79 - 483.79 |
0.1931 times |
Thu 13 February 2025 |
470.74 (0.4%) |
470.74 |
470.74 - 470.74 |
0.1931 times |
Wed 12 February 2025 |
468.85 (-1.06%) |
465.00 |
465.00 - 468.85 |
3.2819 times |
Tue 11 February 2025 |
473.85 (1.56%) |
473.85 |
473.85 - 473.85 |
0.1931 times |
Mon 10 February 2025 |
466.57 (0.54%) |
466.57 |
466.57 - 466.57 |
0.1931 times |
Weekly price and charts WatscoInc Strong weekly Stock price targets for WatscoInc WSO.B are 503.71 and 503.71 | Weekly Target 1 | 503.71 | | Weekly Target 2 | 503.71 | | Weekly Target 3 | 503.71 | | Weekly Target 4 | 503.71 | | Weekly Target 5 | 503.71 |
Weekly price and volumes for Watsco Inc
| Date |
Closing |
Open |
Range |
Volume |
Tue 11 March 2025 |
503.71 (0.37%) |
503.71 |
503.71 - 503.71 |
0.1742 times |
Wed 05 March 2025 |
501.84 (0.1%) |
492.95 |
492.95 - 502.15 |
1.3763 times |
Mon 24 February 2025 |
501.35 (-2.06%) |
501.35 |
501.35 - 501.35 |
0.4355 times |
Wed 19 February 2025 |
511.89 (5.81%) |
529.46 |
511.89 - 529.46 |
0.784 times |
Fri 14 February 2025 |
483.79 (4.25%) |
466.57 |
465.00 - 483.79 |
1.8293 times |
Fri 07 February 2025 |
464.07 (-4.17%) |
482.83 |
464.07 - 482.95 |
2.7875 times |
Fri 31 January 2025 |
484.25 (-9.49%) |
475.15 |
469.95 - 484.25 |
1.1324 times |
Thu 21 November 2024 |
535.00 (2.94%) |
535.00 |
535.00 - 535.00 |
0.1742 times |
Fri 15 November 2024 |
519.70 (10.36%) |
518.97 |
518.97 - 519.70 |
1.2195 times |
Thu 31 October 2024 |
470.90 (-4.87%) |
470.90 |
470.90 - 470.90 |
0.0871 times |
Fri 20 September 2024 |
495.00 (2.06%) |
491.90 |
490.71 - 495.00 |
2.439 times |

Monthly price and charts WatscoInc Strong monthly Stock price targets for WatscoInc WSO.B are 498.33 and 509.09 | Monthly Target 1 | 489.36 | | Monthly Target 2 | 496.54 | | Monthly Target 3 | 500.12333333333 | | Monthly Target 4 | 507.3 | | Monthly Target 5 | 510.88 |
Monthly price and volumes Watsco Inc
| Date |
Closing |
Open |
Range |
Volume |
Tue 11 March 2025 |
503.71 (0.47%) |
492.95 |
492.95 - 503.71 |
0.9898 times |
Mon 24 February 2025 |
501.35 (3.53%) |
482.83 |
464.07 - 529.46 |
3.7255 times |
Fri 31 January 2025 |
484.25 (-9.49%) |
475.15 |
469.95 - 484.25 |
0.7229 times |
Thu 21 November 2024 |
535.00 (13.61%) |
518.97 |
518.97 - 535.00 |
0.8897 times |
Thu 31 October 2024 |
470.90 (-4.87%) |
470.90 |
470.90 - 470.90 |
0.0556 times |
Fri 20 September 2024 |
495.00 (2.04%) |
457.28 |
455.90 - 495.00 |
2.0018 times |
Fri 23 August 2024 |
485.10 (-1.35%) |
456.19 |
456.19 - 485.10 |
1.1905 times |
Thu 25 July 2024 |
491.75 (10.47%) |
486.69 |
486.69 - 491.75 |
0.1462 times |
Wed 24 April 2024 |
445.15 (3.68%) |
424.75 |
424.75 - 445.15 |
0.2224 times |
Tue 26 March 2024 |
429.35 (9.85%) |
429.35 |
429.35 - 429.35 |
0.0556 times |
Wed 24 January 2024 |
390.85 (-7.43%) |
412.60 |
390.85 - 412.60 |
0.3336 times |

DMA SMA EMA moving averages of Watsco Inc WSO.B
DMA (daily moving average) of Watsco Inc WSO.B
| DMA period | DMA value | | 5 day DMA | 502.36 | | 12 day DMA | 489.09 | | 20 day DMA | 491.43 | | 35 day DMA | 476.06 | | 50 day DMA | 439.81 | | 100 day DMA | 358.04 | | 150 day DMA | 331.48 | | 200 day DMA | 310.28 | EMA (exponential moving average) of Watsco Inc WSO.B
| EMA period | EMA current | EMA prev | EMA prev2 | | 5 day EMA | 500.67 | 499.15 | 497.81 | | 12 day EMA | 494.28 | 492.57 | 490.88 | | 20 day EMA | 485.8 | 483.92 | 482.03 | | 35 day EMA | 459.84 | 457.26 | 454.64 | | 50 day EMA | 434.91 | 432.1 | 429.25 |
SMA (simple moving average) of Watsco Inc WSO.B
| SMA period | SMA current | SMA prev | SMA prev2 | | 5 day SMA | 502.36 | 507.51 | 503.9 | | 12 day SMA | 489.09 | 486.88 | 484.77 | | 20 day SMA | 491.43 | 489.79 | 489.45 | | 35 day SMA | 476.06 | 473.73 | 470.54 | | 50 day SMA | 439.81 | 436.04 | 432.04 | | 100 day SMA | 358.04 | 355.75 | 353.67 | | 150 day SMA | 331.48 | 329.83 | 328.05 | | 200 day SMA | 310.28 | 308.93 | 307.59 |
|
|
