WnsHoldings WNS full analysis,charts,indicators,moving averages,SMA,DMA,EMA,ADX,MACD,RSIWns Holdings WNS WideScreen charts, DMA,SMA,EMA technical analysis, forecast prediction, by indicators ADX,MACD,RSI,CCI USA stock exchange
operates under Miscellaneous sector & deals in Business Services
Daily price and charts and targets WnsHoldings Strong Daily Stock price targets for WnsHoldings WNS are 75.53 and 75.73 | Daily Target 1 | 75.47 | | Daily Target 2 | 75.58 | | Daily Target 3 | 75.673333333333 | | Daily Target 4 | 75.78 | | Daily Target 5 | 75.87 |
Daily price and volume Wns Holdings
| Date |
Closing |
Open |
Range |
Volume |
Tue 16 September 2025 |
75.68 (-0.01%) |
75.75 |
75.57 - 75.77 |
1.0405 times |
Mon 15 September 2025 |
75.69 (0.08%) |
75.69 |
75.56 - 75.71 |
0.6809 times |
Fri 12 September 2025 |
75.63 (-0.15%) |
75.59 |
75.48 - 75.71 |
0.4124 times |
Thu 11 September 2025 |
75.74 (0.3%) |
75.50 |
75.48 - 75.84 |
0.7061 times |
Wed 10 September 2025 |
75.51 (0.08%) |
75.44 |
75.42 - 75.54 |
0.7532 times |
Tue 09 September 2025 |
75.45 (-0.08%) |
75.51 |
75.41 - 75.51 |
0.9978 times |
Mon 08 September 2025 |
75.51 (0.15%) |
75.45 |
75.41 - 75.54 |
2.2595 times |
Fri 05 September 2025 |
75.40 (0%) |
75.45 |
75.39 - 75.47 |
1.3025 times |
Thu 04 September 2025 |
75.40 (-0.01%) |
75.40 |
75.40 - 75.49 |
0.7064 times |
Wed 03 September 2025 |
75.41 (0.08%) |
75.37 |
75.37 - 75.53 |
1.1406 times |
Tue 02 September 2025 |
75.35 (-0.13%) |
75.45 |
75.32 - 75.55 |
0.8264 times |
Weekly price and charts WnsHoldings Strong weekly Stock price targets for WnsHoldings WNS are 75.52 and 75.73 | Weekly Target 1 | 75.46 | | Weekly Target 2 | 75.57 | | Weekly Target 3 | 75.67 | | Weekly Target 4 | 75.78 | | Weekly Target 5 | 75.88 |
Weekly price and volumes for Wns Holdings
| Date |
Closing |
Open |
Range |
Volume |
Tue 16 September 2025 |
75.68 (0.07%) |
75.69 |
75.56 - 75.77 |
0.3636 times |
Fri 12 September 2025 |
75.63 (0.31%) |
75.45 |
75.41 - 75.84 |
1.0833 times |
Fri 05 September 2025 |
75.40 (-0.07%) |
75.45 |
75.32 - 75.55 |
0.8397 times |
Fri 29 August 2025 |
75.45 (0%) |
75.55 |
75.45 - 75.56 |
0.154 times |
Fri 29 August 2025 |
75.45 (0.09%) |
75.44 |
75.39 - 75.58 |
0.6838 times |
Fri 22 August 2025 |
75.38 (0.48%) |
75.05 |
75.00 - 75.58 |
0.6638 times |
Fri 15 August 2025 |
75.02 (0.23%) |
74.88 |
74.86 - 75.21 |
0.7831 times |
Fri 08 August 2025 |
74.85 (0.04%) |
74.81 |
74.77 - 75.00 |
1.1772 times |
Fri 01 August 2025 |
74.82 (0.13%) |
74.73 |
74.69 - 75.14 |
1.8253 times |
Fri 25 July 2025 |
74.72 (-0.08%) |
74.75 |
74.65 - 75.09 |
2.4261 times |
Fri 18 July 2025 |
74.78 (0.11%) |
74.74 |
74.60 - 74.83 |
5.9264 times |
Monthly price and charts WnsHoldings Strong monthly Stock price targets for WnsHoldings WNS are 75.5 and 76.02 | Monthly Target 1 | 75.09 | | Monthly Target 2 | 75.39 | | Monthly Target 3 | 75.613333333333 | | Monthly Target 4 | 75.91 | | Monthly Target 5 | 76.13 |
Monthly price and volumes Wns Holdings
| Date |
Closing |
Open |
Range |
Volume |
Tue 16 September 2025 |
75.68 (0.3%) |
75.45 |
75.32 - 75.84 |
0.4161 times |
Fri 29 August 2025 |
75.45 (0.88%) |
74.75 |
74.75 - 75.58 |
0.6848 times |
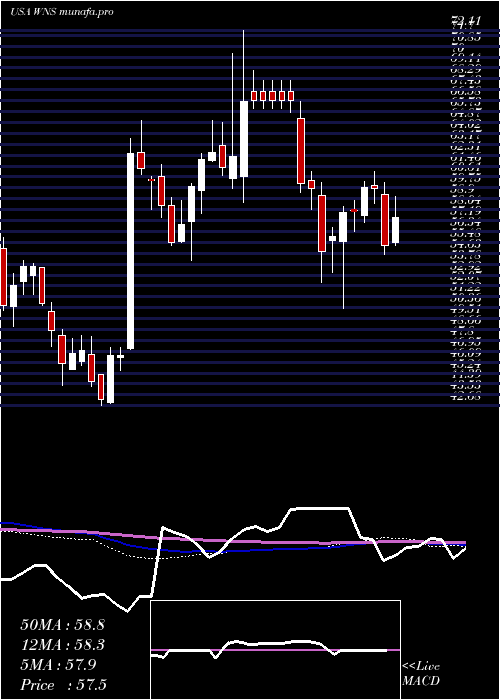
Thu 31 July 2025 |
74.79 (18.26%) |
64.00 |
63.19 - 75.14 |
4.4377 times |
Mon 30 June 2025 |
63.24 (9.05%) |
57.60 |
54.56 - 64.32 |
0.7202 times |
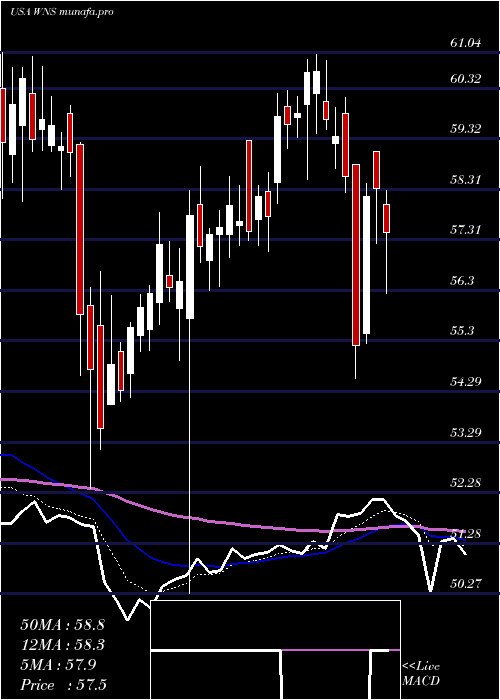
Fri 30 May 2025 |
57.99 (-4.18%) |
60.21 |
50.27 - 60.95 |
0.7805 times |
Wed 30 April 2025 |
60.52 (-1.58%) |
61.35 |
58.07 - 72.11 |
0.9487 times |
Mon 31 March 2025 |
61.49 (8.12%) |
57.11 |
54.08 - 65.01 |
0.5594 times |
Fri 28 February 2025 |
56.87 (-7.15%) |
60.43 |
55.26 - 61.58 |
0.4418 times |
Fri 31 January 2025 |
61.25 (29.25%) |
47.64 |
42.68 - 65.03 |
0.6093 times |
Tue 31 December 2024 |
47.39 (-11.5%) |
53.48 |
44.26 - 53.48 |
0.4014 times |
Tue 26 November 2024 |
53.55 (11.59%) |
48.18 |
46.50 - 55.86 |
0.5215 times |

DMA SMA EMA moving averages of Wns Holdings WNS
DMA (daily moving average) of Wns Holdings WNS
| DMA period | DMA value | | 5 day DMA | 75.65 | | 12 day DMA | 75.52 | | 20 day DMA | 75.49 | | 35 day DMA | 75.25 | | 50 day DMA | 75.1 | | 100 day DMA | 67.06 | | 150 day DMA | 65.22 | | 200 day DMA | 61.7 | EMA (exponential moving average) of Wns Holdings WNS
| EMA period | EMA current | EMA prev | EMA prev2 | | 5 day EMA | 75.64 | 75.62 | 75.58 | | 12 day EMA | 75.54 | 75.52 | 75.49 | | 20 day EMA | 75.39 | 75.36 | 75.33 | | 35 day EMA | 74.93 | 74.89 | 74.84 | | 50 day EMA | 74.45 | 74.4 | 74.35 |
SMA (simple moving average) of Wns Holdings WNS
| SMA period | SMA current | SMA prev | SMA prev2 | | 5 day SMA | 75.65 | 75.6 | 75.57 | | 12 day SMA | 75.52 | 75.5 | 75.48 | | 20 day SMA | 75.49 | 75.46 | 75.43 | | 35 day SMA | 75.25 | 75.22 | 75.2 | | 50 day SMA | 75.1 | 75.08 | 74.87 | | 100 day SMA | 67.06 | 66.94 | 66.85 | | 150 day SMA | 65.22 | 65.12 | 65.01 | | 200 day SMA | 61.7 | 61.58 | 61.46 |
|
|
