TupperwareBrands TUP full analysis,charts,indicators,moving averages,SMA,DMA,EMA,ADX,MACD,RSITupperware Brands TUP WideScreen charts, DMA,SMA,EMA technical analysis, forecast prediction, by indicators ADX,MACD,RSI,CCI USA stock exchange
operates under Consumer Non Durables sector & deals in Plastic Products
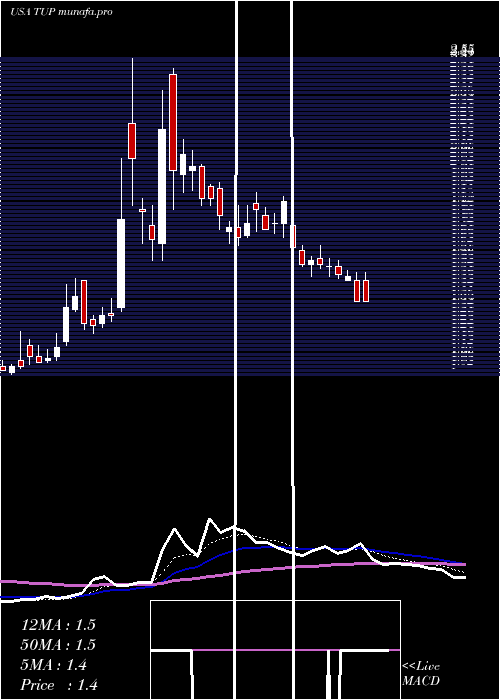
Daily price and charts and targets TupperwareBrands Strong Daily Stock price targets for TupperwareBrands TUP are 1.88 and 2.71 | Daily Target 1 | 1.22 | | Daily Target 2 | 1.71 | | Daily Target 3 | 2.05 | | Daily Target 4 | 2.54 | | Daily Target 5 | 2.88 |
Daily price and volume Tupperware Brands
| Date |
Closing |
Open |
Range |
Volume |
Fri 17 May 2024 |
2.20 (32.53%) |
1.64 |
1.56 - 2.39 |
2.7436 times |
Thu 16 May 2024 |
1.66 (-7.78%) |
1.73 |
1.56 - 1.83 |
0.3167 times |
Wed 15 May 2024 |
1.80 (-12.62%) |
1.81 |
1.64 - 1.86 |
0.6004 times |
Tue 14 May 2024 |
2.06 (17.05%) |
2.23 |
1.83 - 2.55 |
2.6107 times |
Mon 13 May 2024 |
1.76 (36.43%) |
1.33 |
1.31 - 2.06 |
3.2394 times |
Fri 10 May 2024 |
1.29 (0%) |
1.30 |
1.26 - 1.37 |
0.0822 times |
Thu 09 May 2024 |
1.29 (4.03%) |
1.25 |
1.23 - 1.33 |
0.0922 times |
Wed 08 May 2024 |
1.24 (-0.8%) |
1.27 |
1.20 - 1.29 |
0.0466 times |
Tue 07 May 2024 |
1.25 (-9.42%) |
1.46 |
1.22 - 1.46 |
0.1207 times |
Mon 06 May 2024 |
1.38 (3.76%) |
1.32 |
1.31 - 1.47 |
0.1476 times |
Fri 03 May 2024 |
1.33 (17.7%) |
1.16 |
1.14 - 1.44 |
0.1834 times |
Weekly price and charts TupperwareBrands Strong weekly Stock price targets for TupperwareBrands TUP are 1.76 and 3 | Weekly Target 1 | 0.78 | | Weekly Target 2 | 1.49 | | Weekly Target 3 | 2.02 | | Weekly Target 4 | 2.73 | | Weekly Target 5 | 3.26 |
Weekly price and volumes for Tupperware Brands
| Date |
Closing |
Open |
Range |
Volume |
Fri 17 May 2024 |
2.20 (70.54%) |
1.33 |
1.31 - 2.55 |
6.8628 times |
Fri 10 May 2024 |
1.29 (-3.01%) |
1.32 |
1.20 - 1.47 |
0.3531 times |
Fri 03 May 2024 |
1.33 (27.88%) |
1.14 |
1.05 - 1.44 |
0.3441 times |
Fri 26 April 2024 |
1.04 (11.83%) |
0.93 |
0.93 - 1.21 |
0.3484 times |
Fri 19 April 2024 |
0.93 (-10.58%) |
1.05 |
0.93 - 1.06 |
0.3278 times |
Fri 12 April 2024 |
1.04 (-13.33%) |
1.22 |
1.00 - 1.24 |
0.3411 times |
Fri 05 April 2024 |
1.20 (-10.45%) |
1.32 |
1.18 - 1.40 |
0.3346 times |
Thu 28 March 2024 |
1.34 (-7.59%) |
1.43 |
1.33 - 1.49 |
0.2095 times |
Fri 22 March 2024 |
1.45 (-3.97%) |
1.49 |
1.35 - 1.53 |
0.2936 times |
Fri 15 March 2024 |
1.51 (12.69%) |
1.39 |
1.38 - 1.61 |
0.5851 times |
Fri 08 March 2024 |
1.34 (2.29%) |
1.28 |
1.22 - 1.41 |
0.2942 times |
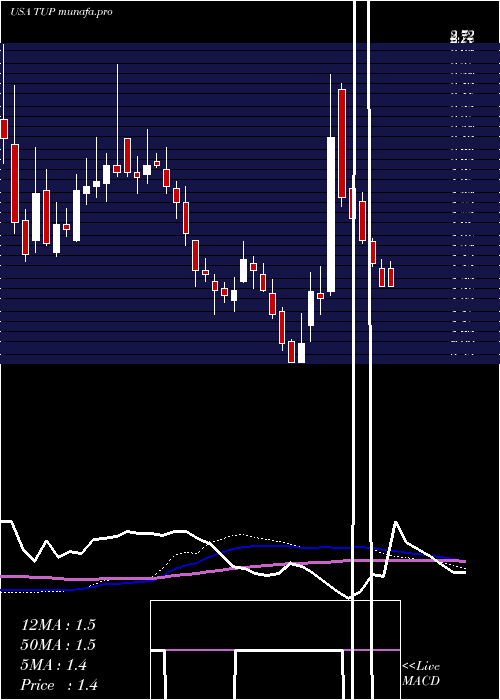
Monthly price and charts TupperwareBrands Strong monthly Stock price targets for TupperwareBrands TUP are 1.63 and 3.12 | Monthly Target 1 | 0.45 | | Monthly Target 2 | 1.32 | | Monthly Target 3 | 1.9366666666667 | | Monthly Target 4 | 2.81 | | Monthly Target 5 | 3.43 |
Monthly price and volumes Tupperware Brands
| Date |
Closing |
Open |
Range |
Volume |
Fri 17 May 2024 |
2.20 (107.55%) |
1.07 |
1.06 - 2.55 |
0.7759 times |
Tue 30 April 2024 |
1.06 (-20.9%) |
1.32 |
0.93 - 1.40 |
0.1535 times |
Thu 28 March 2024 |
1.34 (1.52%) |
1.33 |
1.22 - 1.61 |
0.1493 times |
Thu 29 February 2024 |
1.32 (-22.35%) |
1.73 |
1.20 - 1.75 |
0.1695 times |
Wed 31 January 2024 |
1.70 (-15%) |
2.00 |
1.69 - 2.24 |
0.2536 times |
Fri 29 December 2023 |
2.00 (16.28%) |
1.72 |
1.70 - 2.61 |
0.4347 times |
Thu 30 November 2023 |
1.72 (-15.69%) |
2.01 |
1.53 - 2.05 |
0.3267 times |
Tue 31 October 2023 |
2.04 (45.71%) |
1.46 |
1.15 - 2.72 |
1.877 times |
Fri 29 September 2023 |
1.40 (-43.78%) |
2.55 |
1.38 - 2.59 |
0.5014 times |
Thu 31 August 2023 |
2.49 (-41.69%) |
5.07 |
2.08 - 5.91 |
5.3582 times |
Mon 31 July 2023 |
4.27 (433.75%) |
0.78 |
0.61 - 4.79 |
6.3895 times |

DMA SMA EMA moving averages of Tupperware Brands TUP
DMA (daily moving average) of Tupperware Brands TUP
| DMA period | DMA value | | 5 day DMA | 1.9 | | 12 day DMA | 1.53 | | 20 day DMA | 1.34 | | 35 day DMA | 1.25 | | 50 day DMA | 1.31 | | 100 day DMA | 1.49 | | 150 day DMA | 1.61 | | 200 day DMA | 1.73 | EMA (exponential moving average) of Tupperware Brands TUP
| EMA period | EMA current | EMA prev | EMA prev2 | | 5 day EMA | 1.85 | 1.68 | 1.69 | | 12 day EMA | 1.61 | 1.5 | 1.47 | | 20 day EMA | 1.48 | 1.4 | 1.37 | | 35 day EMA | 1.4 | 1.35 | 1.33 | | 50 day EMA | 1.36 | 1.33 | 1.32 |
SMA (simple moving average) of Tupperware Brands TUP
| SMA period | SMA current | SMA prev | SMA prev2 | | 5 day SMA | 1.9 | 1.71 | 1.64 | | 12 day SMA | 1.53 | 1.44 | 1.39 | | 20 day SMA | 1.34 | 1.28 | 1.25 | | 35 day SMA | 1.25 | 1.22 | 1.21 | | 50 day SMA | 1.31 | 1.29 | 1.28 | | 100 day SMA | 1.49 | 1.49 | 1.5 | | 150 day SMA | 1.61 | 1.6 | 1.61 | | 200 day SMA | 1.73 | 1.74 | 1.75 |
|
|
