TruecarInc TRUE full analysis,charts,indicators,moving averages,SMA,DMA,EMA,ADX,MACD,RSITruecar Inc TRUE WideScreen charts, DMA,SMA,EMA technical analysis, forecast prediction, by indicators ADX,MACD,RSI,CCI USA stock exchange
operates under Technology sector & deals in Computer Software Programming Data Processing
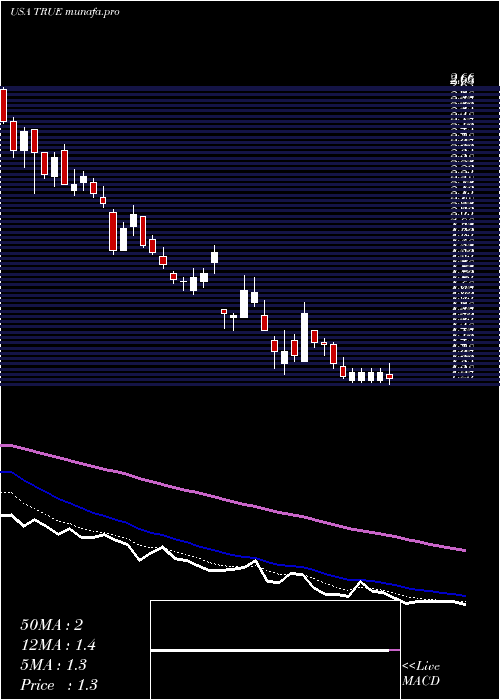
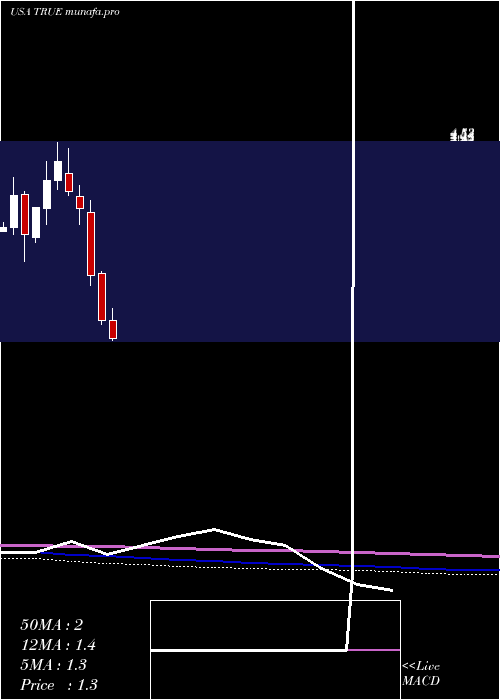
Daily price and charts and targets TruecarInc Strong Daily Stock price targets for TruecarInc TRUE are 2.1 and 2.16 | Daily Target 1 | 2.09 | | Daily Target 2 | 2.11 | | Daily Target 3 | 2.1466666666667 | | Daily Target 4 | 2.17 | | Daily Target 5 | 2.21 |
Daily price and volume Truecar Inc
| Date |
Closing |
Open |
Range |
Volume |
Fri 12 December 2025 |
2.14 (-0.47%) |
2.17 |
2.12 - 2.18 |
0.8838 times |
Thu 11 December 2025 |
2.15 (-0.92%) |
2.17 |
2.15 - 2.20 |
0.7348 times |
Wed 10 December 2025 |
2.17 (-0.91%) |
2.18 |
2.16 - 2.20 |
1.0268 times |
Tue 09 December 2025 |
2.19 (1.86%) |
2.16 |
2.16 - 2.22 |
0.8707 times |
Mon 08 December 2025 |
2.15 (-0.46%) |
2.16 |
2.14 - 2.19 |
0.6957 times |
Fri 05 December 2025 |
2.16 (-0.46%) |
2.18 |
2.10 - 2.20 |
1.3748 times |
Thu 04 December 2025 |
2.17 (-1.36%) |
2.22 |
2.12 - 2.23 |
1.4719 times |
Wed 03 December 2025 |
2.20 (2.8%) |
2.15 |
2.14 - 2.20 |
0.9617 times |
Tue 02 December 2025 |
2.14 (0.94%) |
2.13 |
2.12 - 2.15 |
1.0812 times |
Mon 01 December 2025 |
2.12 (-0.47%) |
2.12 |
2.11 - 2.16 |
0.8985 times |
Fri 28 November 2025 |
2.13 (0.47%) |
2.13 |
2.11 - 2.15 |
0.3489 times |
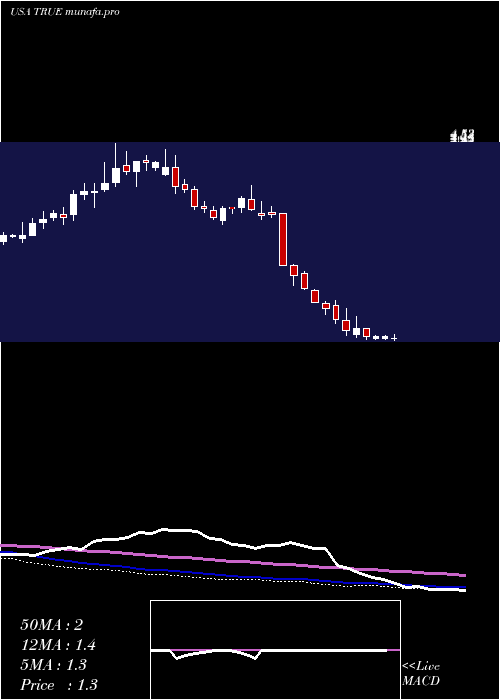
Weekly price and charts TruecarInc Strong weekly Stock price targets for TruecarInc TRUE are 2.08 and 2.18 | Weekly Target 1 | 2.06 | | Weekly Target 2 | 2.1 | | Weekly Target 3 | 2.16 | | Weekly Target 4 | 2.2 | | Weekly Target 5 | 2.26 |
Weekly price and volumes for Truecar Inc
| Date |
Closing |
Open |
Range |
Volume |
Fri 12 December 2025 |
2.14 (-0.93%) |
2.16 |
2.12 - 2.22 |
0.5803 times |
Fri 05 December 2025 |
2.16 (1.41%) |
2.12 |
2.10 - 2.23 |
0.7975 times |
Fri 28 November 2025 |
2.13 (1.91%) |
2.10 |
2.07 - 2.18 |
0.3834 times |
Fri 21 November 2025 |
2.09 (-9.13%) |
2.29 |
2.06 - 2.32 |
0.6347 times |
Fri 14 November 2025 |
2.30 (5.02%) |
2.22 |
2.15 - 2.33 |
0.608 times |
Fri 07 November 2025 |
2.19 (-0.45%) |
2.19 |
2.15 - 2.23 |
0.3761 times |
Fri 31 October 2025 |
2.20 (0%) |
2.30 |
2.00 - 2.31 |
0.4858 times |
Fri 31 October 2025 |
2.20 (-7.56%) |
2.39 |
2.00 - 2.39 |
1.2833 times |
Fri 24 October 2025 |
2.38 (-2.86%) |
2.45 |
2.37 - 2.48 |
1.8675 times |
Fri 17 October 2025 |
2.45 (70.14%) |
1.47 |
1.38 - 2.50 |
2.9834 times |
Fri 10 October 2025 |
1.44 (-18.64%) |
1.79 |
1.43 - 1.89 |
0.4799 times |
Monthly price and charts TruecarInc Strong monthly Stock price targets for TruecarInc TRUE are 2.12 and 2.25 | Monthly Target 1 | 2.03 | | Monthly Target 2 | 2.08 | | Monthly Target 3 | 2.1566666666667 | | Monthly Target 4 | 2.21 | | Monthly Target 5 | 2.29 |
Monthly price and volumes Truecar Inc
| Date |
Closing |
Open |
Range |
Volume |
Fri 12 December 2025 |
2.14 (0.47%) |
2.12 |
2.10 - 2.23 |
0.6085 times |
Fri 28 November 2025 |
2.13 (-3.18%) |
2.19 |
2.06 - 2.33 |
0.8843 times |
Fri 31 October 2025 |
2.20 (19.57%) |
1.82 |
1.38 - 2.50 |
3.2049 times |
Tue 30 September 2025 |
1.84 (-16.36%) |
2.15 |
1.77 - 2.53 |
0.7796 times |
Fri 29 August 2025 |
2.20 (20.22%) |
1.78 |
1.53 - 2.31 |
1.1529 times |
Thu 31 July 2025 |
1.83 (-3.68%) |
1.87 |
1.69 - 2.09 |
0.4809 times |
Mon 30 June 2025 |
1.90 (31.03%) |
1.46 |
1.38 - 2.06 |
0.5851 times |
Fri 30 May 2025 |
1.45 (-2.68%) |
1.50 |
1.05 - 1.74 |
0.8419 times |
Wed 30 April 2025 |
1.49 (-5.7%) |
1.57 |
1.25 - 1.77 |
0.7156 times |
Mon 31 March 2025 |
1.58 (-32.19%) |
2.36 |
1.51 - 2.39 |
0.7463 times |
Fri 28 February 2025 |
2.33 (-32.27%) |
3.37 |
2.16 - 3.57 |
0.9115 times |
DMA SMA EMA moving averages of Truecar Inc TRUE
DMA (daily moving average) of Truecar Inc TRUE
| DMA period | DMA value | | 5 day DMA | 2.16 | | 12 day DMA | 2.15 | | 20 day DMA | 2.16 | | 35 day DMA | 2.2 | | 50 day DMA | 2.13 | | 100 day DMA | 2.08 | | 150 day DMA | 1.95 | | 200 day DMA | 1.88 | EMA (exponential moving average) of Truecar Inc TRUE
| EMA period | EMA current | EMA prev | EMA prev2 | | 5 day EMA | 2.15 | 2.16 | 2.17 | | 12 day EMA | 2.16 | 2.16 | 2.16 | | 20 day EMA | 2.15 | 2.15 | 2.15 | | 35 day EMA | 2.12 | 2.12 | 2.12 | | 50 day EMA | 2.1 | 2.1 | 2.1 |
SMA (simple moving average) of Truecar Inc TRUE
| SMA period | SMA current | SMA prev | SMA prev2 | | 5 day SMA | 2.16 | 2.16 | 2.17 | | 12 day SMA | 2.15 | 2.16 | 2.15 | | 20 day SMA | 2.16 | 2.17 | 2.18 | | 35 day SMA | 2.2 | 2.21 | 2.22 | | 50 day SMA | 2.13 | 2.13 | 2.12 | | 100 day SMA | 2.08 | 2.08 | 2.08 | | 150 day SMA | 1.95 | 1.95 | 1.94 | | 200 day SMA | 1.88 | 1.88 | 1.88 |
|
|
