SynlogicInc SYBX full analysis,charts,indicators,moving averages,SMA,DMA,EMA,ADX,MACD,RSISynlogic Inc SYBX WideScreen charts, DMA,SMA,EMA technical analysis, forecast prediction, by indicators ADX,MACD,RSI,CCI USA stock exchange
operates under N A sector & deals in N A
Daily price and charts and targets SynlogicInc Strong Daily Stock price targets for SynlogicInc SYBX are 1.58 and 1.66 | Daily Target 1 | 1.56 | | Daily Target 2 | 1.59 | | Daily Target 3 | 1.64 | | Daily Target 4 | 1.67 | | Daily Target 5 | 1.72 |
Daily price and volume Synlogic Inc
| Date |
Closing |
Open |
Range |
Volume |
Wed 19 November 2025 |
1.62 (-1.82%) |
1.69 |
1.61 - 1.69 |
0.1223 times |
Tue 18 November 2025 |
1.65 (-2.37%) |
1.72 |
1.61 - 1.72 |
1.0396 times |
Mon 17 November 2025 |
1.69 (0.6%) |
1.70 |
1.67 - 1.76 |
0.661 times |
Fri 14 November 2025 |
1.68 (0.6%) |
1.68 |
1.66 - 1.75 |
1.0221 times |
Thu 13 November 2025 |
1.67 (-0.6%) |
1.64 |
1.64 - 1.86 |
2.0122 times |
Wed 12 November 2025 |
1.68 (5.66%) |
1.60 |
1.60 - 1.69 |
0.3436 times |
Tue 11 November 2025 |
1.59 (-1.85%) |
1.64 |
1.59 - 1.65 |
0.3436 times |
Mon 10 November 2025 |
1.62 (1.89%) |
1.59 |
1.52 - 1.73 |
3.1945 times |
Fri 07 November 2025 |
1.59 (-3.05%) |
1.59 |
1.56 - 1.61 |
0.2999 times |
Thu 06 November 2025 |
1.64 (1.23%) |
1.60 |
1.55 - 1.77 |
0.961 times |
Wed 05 November 2025 |
1.62 (1.25%) |
1.64 |
1.58 - 1.65 |
1.0513 times |
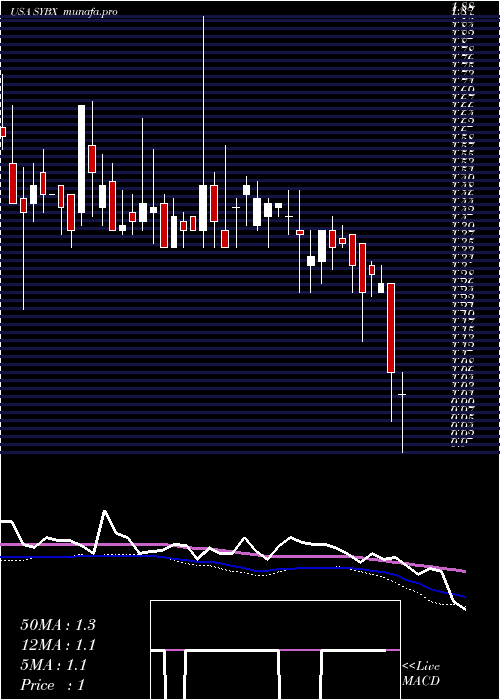
Weekly price and charts SynlogicInc Strong weekly Stock price targets for SynlogicInc SYBX are 1.54 and 1.69 | Weekly Target 1 | 1.51 | | Weekly Target 2 | 1.57 | | Weekly Target 3 | 1.6633333333333 | | Weekly Target 4 | 1.72 | | Weekly Target 5 | 1.81 |
Weekly price and volumes for Synlogic Inc
| Date |
Closing |
Open |
Range |
Volume |
Wed 19 November 2025 |
1.62 (-3.57%) |
1.70 |
1.61 - 1.76 |
0.432 times |
Fri 14 November 2025 |
1.68 (5.66%) |
1.59 |
1.52 - 1.86 |
1.639 times |
Fri 07 November 2025 |
1.59 (-5.92%) |
1.71 |
1.55 - 1.81 |
0.7301 times |
Fri 31 October 2025 |
1.69 (0%) |
1.67 |
1.67 - 1.74 |
0.3527 times |
Fri 31 October 2025 |
1.69 (-4.52%) |
1.75 |
1.67 - 1.87 |
1.5707 times |
Fri 24 October 2025 |
1.77 (-3.28%) |
1.83 |
1.64 - 1.87 |
2.1628 times |
Fri 17 October 2025 |
1.83 (8.93%) |
1.70 |
1.55 - 1.84 |
1.8095 times |
Fri 10 October 2025 |
1.68 (1.2%) |
1.61 |
1.61 - 1.75 |
0.5749 times |
Fri 03 October 2025 |
1.66 (-4.6%) |
1.68 |
1.61 - 1.74 |
0.3349 times |
Fri 26 September 2025 |
1.74 (-2.25%) |
1.79 |
1.62 - 1.79 |
0.3934 times |
Fri 19 September 2025 |
1.78 (11.95%) |
1.56 |
1.56 - 1.78 |
0.9827 times |
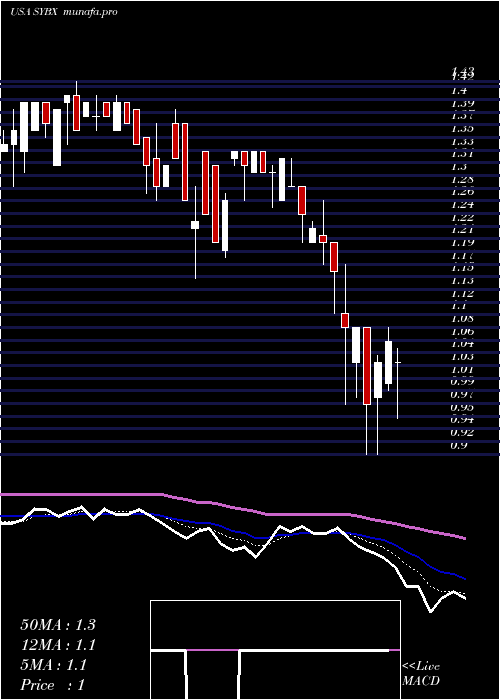
Monthly price and charts SynlogicInc Strong monthly Stock price targets for SynlogicInc SYBX are 1.4 and 1.74 | Monthly Target 1 | 1.33 | | Monthly Target 2 | 1.47 | | Monthly Target 3 | 1.6666666666667 | | Monthly Target 4 | 1.81 | | Monthly Target 5 | 2.01 |
Monthly price and volumes Synlogic Inc
| Date |
Closing |
Open |
Range |
Volume |
Wed 19 November 2025 |
1.62 (-4.14%) |
1.71 |
1.52 - 1.86 |
0.7261 times |
Fri 31 October 2025 |
1.69 (1.2%) |
1.61 |
1.55 - 1.87 |
1.7384 times |
Tue 30 September 2025 |
1.67 (15.17%) |
1.45 |
1.41 - 1.79 |
0.7236 times |
Fri 29 August 2025 |
1.45 (-5.84%) |
1.54 |
1.33 - 1.67 |
1.5897 times |
Thu 31 July 2025 |
1.54 (21.26%) |
1.27 |
1.18 - 1.96 |
3.3025 times |
Mon 30 June 2025 |
1.27 (10.43%) |
1.16 |
1.15 - 1.29 |
0.2891 times |
Fri 30 May 2025 |
1.15 (0.88%) |
1.07 |
1.00 - 1.20 |
0.4443 times |
Wed 30 April 2025 |
1.14 (-8.06%) |
1.20 |
0.90 - 1.26 |
0.4562 times |
Mon 31 March 2025 |
1.24 (-9.49%) |
1.39 |
1.15 - 1.39 |
0.2043 times |
Fri 28 February 2025 |
1.37 (-1.44%) |
1.32 |
1.26 - 1.43 |
0.5259 times |
Fri 31 January 2025 |
1.39 (-0.71%) |
1.40 |
1.26 - 1.52 |
0.8497 times |
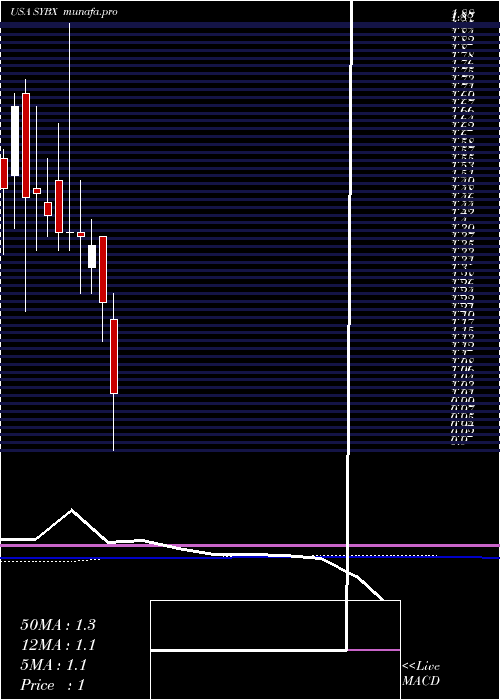
DMA SMA EMA moving averages of Synlogic Inc SYBX
DMA (daily moving average) of Synlogic Inc SYBX
| DMA period | DMA value | | 5 day DMA | 1.66 | | 12 day DMA | 1.64 | | 20 day DMA | 1.68 | | 35 day DMA | 1.69 | | 50 day DMA | 1.69 | | 100 day DMA | 1.56 | | 150 day DMA | 1.43 | | 200 day DMA | 1.39 | EMA (exponential moving average) of Synlogic Inc SYBX
| EMA period | EMA current | EMA prev | EMA prev2 | | 5 day EMA | 1.65 | 1.66 | 1.67 | | 12 day EMA | 1.65 | 1.66 | 1.66 | | 20 day EMA | 1.66 | 1.66 | 1.66 | | 35 day EMA | 1.67 | 1.67 | 1.67 | | 50 day EMA | 1.67 | 1.67 | 1.67 |
SMA (simple moving average) of Synlogic Inc SYBX
| SMA period | SMA current | SMA prev | SMA prev2 | | 5 day SMA | 1.66 | 1.67 | 1.66 | | 12 day SMA | 1.64 | 1.64 | 1.65 | | 20 day SMA | 1.68 | 1.68 | 1.69 | | 35 day SMA | 1.69 | 1.69 | 1.69 | | 50 day SMA | 1.69 | 1.68 | 1.68 | | 100 day SMA | 1.56 | 1.56 | 1.56 | | 150 day SMA | 1.43 | 1.42 | 1.42 | | 200 day SMA | 1.39 | 1.39 | 1.38 |
|
|
