SterlingBancorp SBT full analysis,charts,indicators,moving averages,SMA,DMA,EMA,ADX,MACD,RSISterling Bancorp SBT WideScreen charts, DMA,SMA,EMA technical analysis, forecast prediction, by indicators ADX,MACD,RSI,CCI USA stock exchange
operates under Finance sector & deals in Savings Institutions
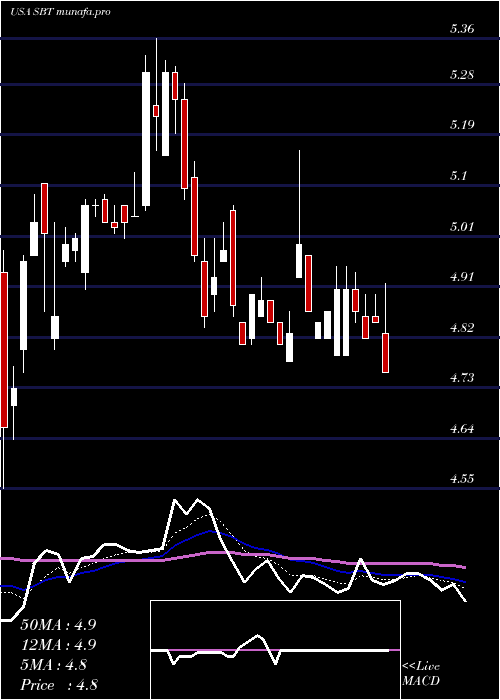
Daily price and charts and targets SterlingBancorp Strong Daily Stock price targets for SterlingBancorp SBT are 4.98 and 5.19 | Daily Target 1 | 4.94 | | Daily Target 2 | 5.01 | | Daily Target 3 | 5.1466666666667 | | Daily Target 4 | 5.22 | | Daily Target 5 | 5.36 |
Daily price and volume Sterling Bancorp
| Date |
Closing |
Open |
Range |
Volume |
Thu 23 May 2024 |
5.09 (-3.05%) |
5.25 |
5.07 - 5.28 |
0.8539 times |
Wed 22 May 2024 |
5.25 (-0.94%) |
5.30 |
5.19 - 5.31 |
0.5817 times |
Tue 21 May 2024 |
5.30 (1.53%) |
5.15 |
5.15 - 5.32 |
0.4069 times |
Mon 20 May 2024 |
5.22 (-1.51%) |
5.24 |
5.16 - 5.36 |
0.6005 times |
Fri 17 May 2024 |
5.30 (5.16%) |
5.06 |
5.05 - 5.33 |
2.5628 times |
Thu 16 May 2024 |
5.04 (0.2%) |
5.04 |
5.04 - 5.12 |
2.1429 times |
Wed 15 May 2024 |
5.03 (0.2%) |
5.06 |
5.00 - 5.06 |
0.9028 times |
Tue 14 May 2024 |
5.02 (-0.2%) |
5.03 |
5.01 - 5.06 |
0.6877 times |
Mon 13 May 2024 |
5.03 (-0.59%) |
5.07 |
5.03 - 5.08 |
0.5387 times |
Fri 10 May 2024 |
5.06 (0%) |
5.06 |
5.04 - 5.07 |
0.7221 times |
Thu 09 May 2024 |
5.06 (1.2%) |
4.94 |
4.91 - 5.07 |
1.6763 times |
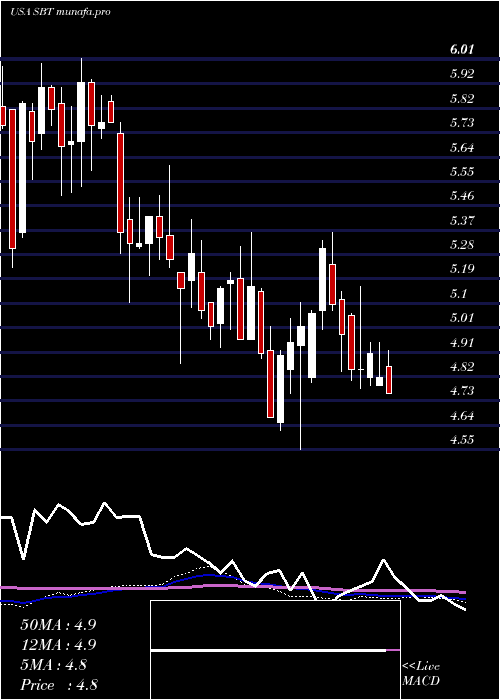
Weekly price and charts SterlingBancorp Strong weekly Stock price targets for SterlingBancorp SBT are 4.94 and 5.23 | Weekly Target 1 | 4.88 | | Weekly Target 2 | 4.99 | | Weekly Target 3 | 5.1733333333333 | | Weekly Target 4 | 5.28 | | Weekly Target 5 | 5.46 |
Weekly price and volumes for Sterling Bancorp
| Date |
Closing |
Open |
Range |
Volume |
Thu 23 May 2024 |
5.09 (-3.96%) |
5.24 |
5.07 - 5.36 |
0.4681 times |
Fri 17 May 2024 |
5.30 (4.74%) |
5.07 |
5.00 - 5.33 |
1.3096 times |
Fri 10 May 2024 |
5.06 (1%) |
4.82 |
4.80 - 5.07 |
1.6131 times |
Fri 03 May 2024 |
5.01 (1.21%) |
4.94 |
4.55 - 5.10 |
1.8058 times |
Fri 26 April 2024 |
4.95 (1.02%) |
4.85 |
4.76 - 5.04 |
0.7478 times |
Fri 19 April 2024 |
4.90 (4.93%) |
4.65 |
4.62 - 4.92 |
0.5776 times |
Fri 12 April 2024 |
4.67 (-4.89%) |
4.92 |
4.67 - 5.01 |
0.7818 times |
Fri 05 April 2024 |
4.91 (-4.84%) |
5.14 |
4.89 - 5.15 |
0.5721 times |
Thu 28 March 2024 |
5.16 (4.03%) |
4.96 |
4.96 - 5.36 |
1.3001 times |
Fri 22 March 2024 |
4.96 (-4.25%) |
5.19 |
4.96 - 5.31 |
0.8241 times |
Fri 15 March 2024 |
5.18 (0.58%) |
5.17 |
5.00 - 5.21 |
0.7879 times |
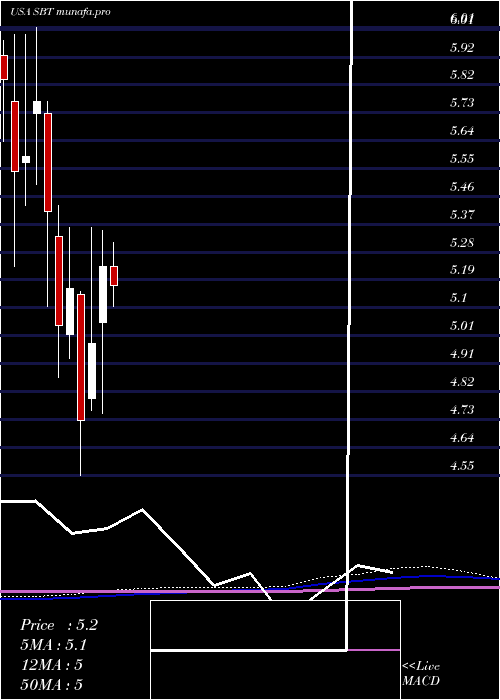
Monthly price and charts SterlingBancorp Strong monthly Stock price targets for SterlingBancorp SBT are 4.93 and 5.53 | Monthly Target 1 | 4.47 | | Monthly Target 2 | 4.78 | | Monthly Target 3 | 5.07 | | Monthly Target 4 | 5.38 | | Monthly Target 5 | 5.67 |
Monthly price and volumes Sterling Bancorp
| Date |
Closing |
Open |
Range |
Volume |
Thu 23 May 2024 |
5.09 (7.61%) |
4.80 |
4.76 - 5.36 |
0.963 times |
Tue 30 April 2024 |
4.73 (-8.33%) |
5.14 |
4.55 - 5.15 |
0.9102 times |
Thu 28 March 2024 |
5.16 (2.38%) |
5.01 |
4.93 - 5.36 |
0.9901 times |
Thu 29 February 2024 |
5.04 (-6.84%) |
5.33 |
4.87 - 5.43 |
1.1221 times |
Wed 31 January 2024 |
5.41 (-6.24%) |
5.73 |
5.10 - 5.77 |
1.1237 times |
Fri 29 December 2023 |
5.77 (3.22%) |
5.73 |
5.50 - 6.01 |
1.0312 times |
Thu 30 November 2023 |
5.59 (0.9%) |
5.57 |
5.43 - 5.99 |
0.6233 times |
Tue 31 October 2023 |
5.54 (-5.14%) |
5.77 |
5.23 - 5.99 |
0.8903 times |
Fri 29 September 2023 |
5.84 (-0.85%) |
5.91 |
5.64 - 6.21 |
1.2717 times |
Thu 31 August 2023 |
5.89 (-0.84%) |
5.94 |
5.87 - 6.26 |
1.0744 times |
Mon 31 July 2023 |
5.94 (8.59%) |
5.50 |
5.31 - 6.03 |
2.2539 times |
DMA SMA EMA moving averages of Sterling Bancorp SBT
DMA (daily moving average) of Sterling Bancorp SBT
| DMA period | DMA value | | 5 day DMA | 5.23 | | 12 day DMA | 5.12 | | 20 day DMA | 5.03 | | 35 day DMA | 4.94 | | 50 day DMA | 4.98 | | 100 day DMA | 5.1 | | 150 day DMA | 5.31 | | 200 day DMA | 5.46 | EMA (exponential moving average) of Sterling Bancorp SBT
| EMA period | EMA current | EMA prev | EMA prev2 | | 5 day EMA | 5.18 | 5.22 | 5.2 | | 12 day EMA | 5.12 | 5.13 | 5.11 | | 20 day EMA | 5.08 | 5.08 | 5.06 | | 35 day EMA | 5.02 | 5.02 | 5.01 | | 50 day EMA | 5.01 | 5.01 | 5 |
SMA (simple moving average) of Sterling Bancorp SBT
| SMA period | SMA current | SMA prev | SMA prev2 | | 5 day SMA | 5.23 | 5.22 | 5.18 | | 12 day SMA | 5.12 | 5.11 | 5.08 | | 20 day SMA | 5.03 | 5.02 | 5 | | 35 day SMA | 4.94 | 4.94 | 4.93 | | 50 day SMA | 4.98 | 4.98 | 4.98 | | 100 day SMA | 5.1 | 5.1 | 5.11 | | 150 day SMA | 5.31 | 5.31 | 5.31 | | 200 day SMA | 5.46 | 5.46 | 5.47 |
|
|
