ProvidentBancorp PVBC full analysis,charts,indicators,moving averages,SMA,DMA,EMA,ADX,MACD,RSIProvident Bancorp PVBC WideScreen charts, DMA,SMA,EMA technical analysis, forecast prediction, by indicators ADX,MACD,RSI,CCI USA stock exchange
operates under Finance sector & deals in Savings Institutions
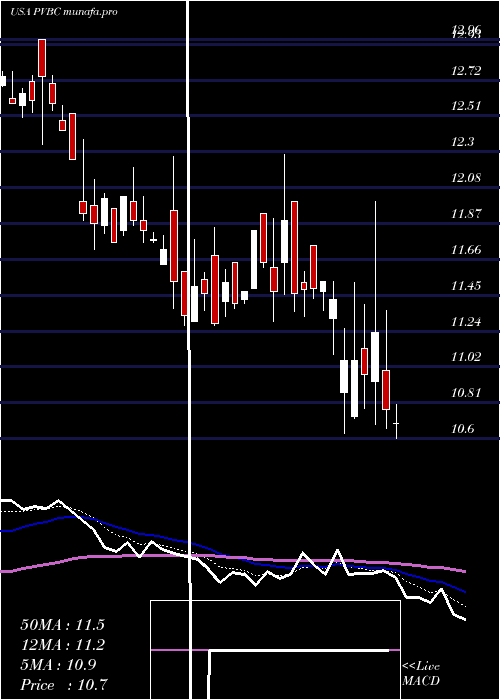
Daily price and charts and targets ProvidentBancorp Strong Daily Stock price targets for ProvidentBancorp PVBC are 12.69 and 12.94 | Daily Target 1 | 12.51 | | Daily Target 2 | 12.61 | | Daily Target 3 | 12.763333333333 | | Daily Target 4 | 12.86 | | Daily Target 5 | 13.01 |
Daily price and volume Provident Bancorp
| Date |
Closing |
Open |
Range |
Volume |
Wed 17 September 2025 |
12.70 (0.08%) |
12.68 |
12.67 - 12.92 |
1.3904 times |
Tue 16 September 2025 |
12.69 (-0.47%) |
12.72 |
12.66 - 12.76 |
1.0956 times |
Mon 15 September 2025 |
12.75 (0.31%) |
12.70 |
12.65 - 12.75 |
0.9004 times |
Fri 12 September 2025 |
12.71 (-0.7%) |
12.81 |
12.68 - 12.81 |
0.6534 times |
Thu 11 September 2025 |
12.80 (0.55%) |
12.68 |
12.68 - 12.80 |
0.9402 times |
Wed 10 September 2025 |
12.73 (-0.31%) |
12.75 |
12.69 - 12.75 |
0.992 times |
Tue 09 September 2025 |
12.77 (-0.7%) |
12.83 |
12.73 - 12.83 |
0.9163 times |
Mon 08 September 2025 |
12.86 (0.08%) |
12.90 |
12.74 - 12.90 |
1.0677 times |
Fri 05 September 2025 |
12.85 (-0.93%) |
13.00 |
12.83 - 13.01 |
1.2072 times |
Thu 04 September 2025 |
12.97 (0.86%) |
12.91 |
12.87 - 12.97 |
0.8367 times |
Wed 03 September 2025 |
12.86 (-0.08%) |
12.81 |
12.79 - 12.88 |
0.8765 times |
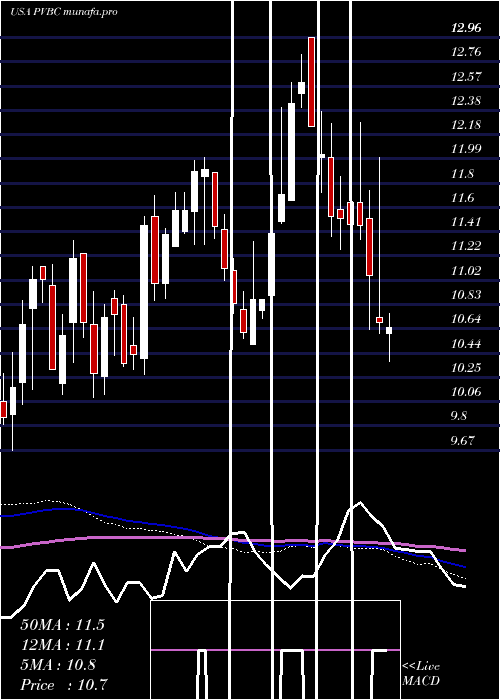
Weekly price and charts ProvidentBancorp Strong weekly Stock price targets for ProvidentBancorp PVBC are 12.57 and 12.84 | Weekly Target 1 | 12.49 | | Weekly Target 2 | 12.59 | | Weekly Target 3 | 12.756666666667 | | Weekly Target 4 | 12.86 | | Weekly Target 5 | 13.03 |
Weekly price and volumes for Provident Bancorp
| Date |
Closing |
Open |
Range |
Volume |
Wed 17 September 2025 |
12.70 (-0.08%) |
12.70 |
12.65 - 12.92 |
0.4319 times |
Fri 12 September 2025 |
12.71 (-1.09%) |
12.90 |
12.68 - 12.90 |
0.5829 times |
Fri 05 September 2025 |
12.85 (-0.16%) |
12.97 |
12.77 - 13.01 |
0.5143 times |
Fri 29 August 2025 |
12.87 (0%) |
12.94 |
12.85 - 12.98 |
0.1972 times |
Fri 29 August 2025 |
12.87 (0%) |
12.82 |
12.77 - 12.99 |
0.7892 times |
Fri 22 August 2025 |
12.87 (2.96%) |
12.46 |
12.39 - 12.90 |
0.7993 times |
Fri 15 August 2025 |
12.50 (2.54%) |
12.32 |
12.19 - 12.81 |
1.0946 times |
Fri 08 August 2025 |
12.19 (0.41%) |
12.18 |
12.10 - 12.27 |
0.8608 times |
Fri 01 August 2025 |
12.14 (-4.33%) |
12.66 |
12.00 - 12.67 |
2.647 times |
Fri 25 July 2025 |
12.69 (0.55%) |
12.63 |
12.51 - 13.02 |
2.0829 times |
Fri 18 July 2025 |
12.62 (-1.64%) |
12.86 |
12.52 - 13.00 |
2.0138 times |
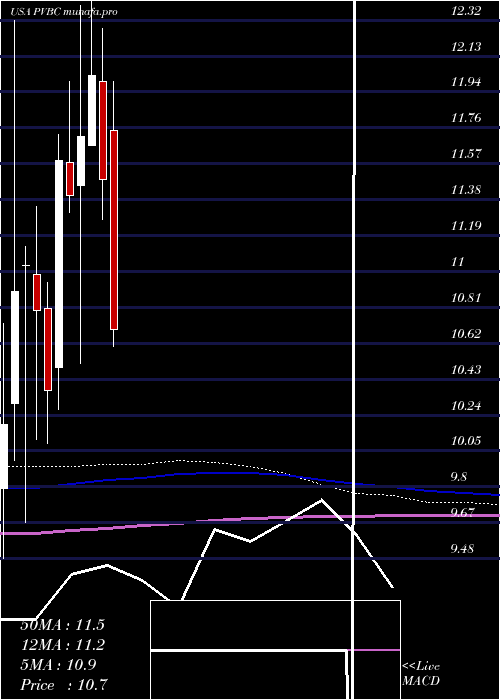
Monthly price and charts ProvidentBancorp Strong monthly Stock price targets for ProvidentBancorp PVBC are 12.5 and 12.86 | Monthly Target 1 | 12.43 | | Monthly Target 2 | 12.56 | | Monthly Target 3 | 12.786666666667 | | Monthly Target 4 | 12.92 | | Monthly Target 5 | 13.15 |
Monthly price and volumes Provident Bancorp
| Date |
Closing |
Open |
Range |
Volume |
Wed 17 September 2025 |
12.70 (-1.32%) |
12.97 |
12.65 - 13.01 |
0.21 times |
Fri 29 August 2025 |
12.87 (5.41%) |
12.15 |
12.00 - 12.99 |
0.6657 times |
Thu 31 July 2025 |
12.21 (-2.24%) |
12.49 |
12.20 - 13.02 |
1.5542 times |
Mon 30 June 2025 |
12.49 (9.66%) |
11.37 |
11.23 - 12.58 |
5.4049 times |
Fri 30 May 2025 |
11.39 (2.61%) |
11.02 |
10.94 - 11.58 |
0.4466 times |
Wed 30 April 2025 |
11.10 (-3.31%) |
11.74 |
10.38 - 12.00 |
0.3369 times |
Mon 31 March 2025 |
11.48 (-4.57%) |
12.00 |
11.27 - 12.28 |
0.2819 times |
Fri 28 February 2025 |
12.03 (2.73%) |
11.66 |
11.66 - 12.96 |
0.3728 times |
Fri 31 January 2025 |
11.71 (2.72%) |
11.45 |
10.51 - 12.40 |
0.367 times |
Tue 31 December 2024 |
11.40 (-1.55%) |
11.57 |
11.31 - 12.00 |
0.36 times |
Tue 26 November 2024 |
11.58 (11.67%) |
10.49 |
10.27 - 11.72 |
0.6054 times |
DMA SMA EMA moving averages of Provident Bancorp PVBC
DMA (daily moving average) of Provident Bancorp PVBC
| DMA period | DMA value | | 5 day DMA | 12.73 | | 12 day DMA | 12.8 | | 20 day DMA | 12.82 | | 35 day DMA | 12.64 | | 50 day DMA | 12.66 | | 100 day DMA | 12.12 | | 150 day DMA | 11.93 | | 200 day DMA | 11.81 | EMA (exponential moving average) of Provident Bancorp PVBC
| EMA period | EMA current | EMA prev | EMA prev2 | | 5 day EMA | 12.73 | 12.74 | 12.76 | | 12 day EMA | 12.76 | 12.77 | 12.78 | | 20 day EMA | 12.75 | 12.75 | 12.76 | | 35 day EMA | 12.74 | 12.74 | 12.74 | | 50 day EMA | 12.66 | 12.66 | 12.66 |
SMA (simple moving average) of Provident Bancorp PVBC
| SMA period | SMA current | SMA prev | SMA prev2 | | 5 day SMA | 12.73 | 12.74 | 12.75 | | 12 day SMA | 12.8 | 12.81 | 12.83 | | 20 day SMA | 12.82 | 12.81 | 12.81 | | 35 day SMA | 12.64 | 12.63 | 12.63 | | 50 day SMA | 12.66 | 12.66 | 12.66 | | 100 day SMA | 12.12 | 12.1 | 12.09 | | 150 day SMA | 11.93 | 11.93 | 11.93 | | 200 day SMA | 11.81 | 11.81 | 11.8 |
|
|
