PiedmontLithium PLL full analysis,charts,indicators,moving averages,SMA,DMA,EMA,ADX,MACD,RSIPiedmont Lithium PLL WideScreen charts, DMA,SMA,EMA technical analysis, forecast prediction, by indicators ADX,MACD,RSI,CCI USA stock exchange
operates under N A sector & deals in N A
Daily price and charts and targets PiedmontLithium Strong Daily Stock price targets for PiedmontLithium PLL are 7.15 and 7.51 | Daily Target 1 | 6.87 | | Daily Target 2 | 7.07 | | Daily Target 3 | 7.23 | | Daily Target 4 | 7.43 | | Daily Target 5 | 7.59 |
Daily price and volume Piedmont Lithium
| Date |
Closing |
Open |
Range |
Volume |
Fri 01 August 2025 |
7.27 (-0.41%) |
7.24 |
7.03 - 7.39 |
0.4633 times |
Thu 31 July 2025 |
7.30 (0.27%) |
7.31 |
7.19 - 7.43 |
0.6129 times |
Wed 30 July 2025 |
7.28 (0.28%) |
7.31 |
7.10 - 7.64 |
0.8894 times |
Tue 29 July 2025 |
7.26 (-6.44%) |
7.76 |
7.15 - 7.83 |
1.0165 times |
Mon 28 July 2025 |
7.76 (-4.67%) |
8.23 |
7.64 - 8.25 |
1.1169 times |
Fri 25 July 2025 |
8.14 (-5.24%) |
8.59 |
8.06 - 8.62 |
0.7847 times |
Thu 24 July 2025 |
8.59 (-4.13%) |
8.97 |
8.40 - 9.10 |
1.23 times |
Wed 23 July 2025 |
8.96 (9.54%) |
8.31 |
8.18 - 9.15 |
1.6373 times |
Tue 22 July 2025 |
8.18 (3.02%) |
8.01 |
7.98 - 8.63 |
1.3906 times |
Mon 21 July 2025 |
7.94 (1.15%) |
8.02 |
7.77 - 8.22 |
0.8584 times |
Fri 18 July 2025 |
7.85 (-5.99%) |
8.26 |
7.61 - 8.30 |
1.337 times |
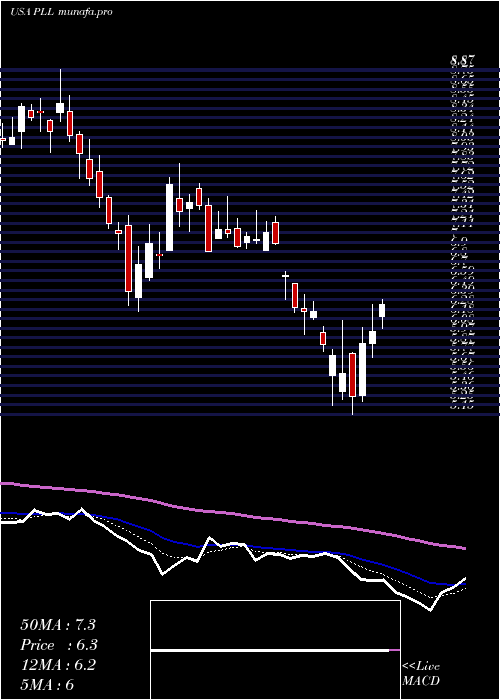
Weekly price and charts PiedmontLithium Strong weekly Stock price targets for PiedmontLithium PLL are 6.54 and 7.76 | Weekly Target 1 | 6.3 | | Weekly Target 2 | 6.78 | | Weekly Target 3 | 7.5166666666667 | | Weekly Target 4 | 8 | | Weekly Target 5 | 8.74 |
Weekly price and volumes for Piedmont Lithium
| Date |
Closing |
Open |
Range |
Volume |
Fri 01 August 2025 |
7.27 (-10.69%) |
8.23 |
7.03 - 8.25 |
1.1154 times |
Fri 25 July 2025 |
8.14 (3.69%) |
8.02 |
7.77 - 9.15 |
1.6058 times |
Fri 18 July 2025 |
7.85 (12.95%) |
7.00 |
6.66 - 8.48 |
2.0721 times |
Fri 11 July 2025 |
6.95 (6.6%) |
6.43 |
6.14 - 7.50 |
1.426 times |
Thu 03 July 2025 |
6.52 (11.64%) |
5.82 |
5.68 - 6.87 |
0.7958 times |
Fri 27 June 2025 |
5.84 (1.57%) |
5.70 |
5.47 - 5.92 |
0.8489 times |
Fri 20 June 2025 |
5.75 (-5.12%) |
6.04 |
5.71 - 6.15 |
0.3952 times |
Fri 13 June 2025 |
6.06 (-2.73%) |
6.28 |
5.90 - 6.57 |
0.7674 times |
Fri 06 June 2025 |
6.23 (0.81%) |
6.19 |
5.85 - 6.38 |
0.4595 times |
Fri 30 May 2025 |
6.18 (-3.13%) |
6.43 |
6.05 - 6.60 |
0.514 times |
Fri 23 May 2025 |
6.38 (-2.74%) |
6.54 |
6.12 - 6.60 |
0.4101 times |
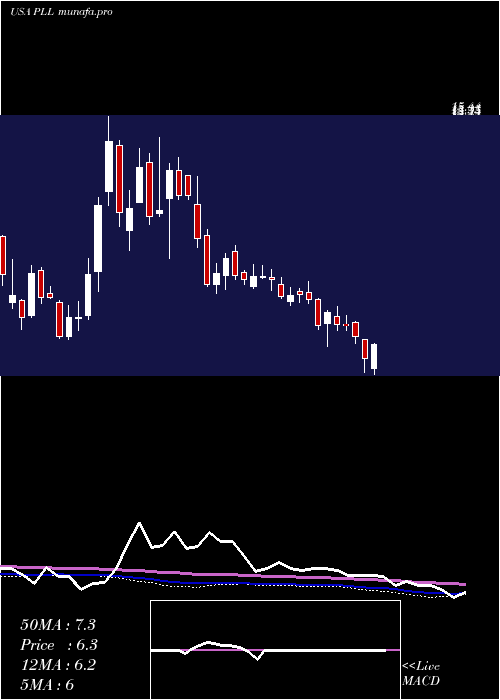
Monthly price and charts PiedmontLithium Strong monthly Stock price targets for PiedmontLithium PLL are 7.15 and 7.51 | Monthly Target 1 | 6.87 | | Monthly Target 2 | 7.07 | | Monthly Target 3 | 7.23 | | Monthly Target 4 | 7.43 | | Monthly Target 5 | 7.59 |
Monthly price and volumes Piedmont Lithium
| Date |
Closing |
Open |
Range |
Volume |
Fri 01 August 2025 |
7.27 (-0.41%) |
7.24 |
7.03 - 7.39 |
0.0332 times |
Thu 31 July 2025 |
7.30 (25.43%) |
5.82 |
5.82 - 9.15 |
1.7822 times |
Mon 30 June 2025 |
5.82 (-5.83%) |
6.19 |
5.47 - 6.57 |
0.6804 times |
Fri 30 May 2025 |
6.18 (-17.38%) |
7.61 |
6.05 - 7.94 |
0.6031 times |
Wed 30 April 2025 |
7.48 (18.73%) |
6.29 |
5.15 - 8.99 |
0.8512 times |
Mon 31 March 2025 |
6.30 (-11.27%) |
7.18 |
6.25 - 7.85 |
0.8262 times |
Fri 28 February 2025 |
7.10 (-13.94%) |
8.06 |
6.93 - 8.87 |
0.6945 times |
Fri 31 January 2025 |
8.25 (-5.61%) |
8.84 |
8.20 - 10.31 |
0.9991 times |
Tue 31 December 2024 |
8.74 (-28.89%) |
11.93 |
8.37 - 13.06 |
1.2485 times |
Tue 26 November 2024 |
12.29 (-6.18%) |
13.50 |
9.77 - 14.60 |
2.2817 times |
Thu 31 October 2024 |
13.10 (46.7%) |
8.98 |
8.45 - 15.44 |
4.5565 times |

DMA SMA EMA moving averages of Piedmont Lithium PLL
DMA (daily moving average) of Piedmont Lithium PLL
| DMA period | DMA value | | 5 day DMA | 7.37 | | 12 day DMA | 7.91 | | 20 day DMA | 7.49 | | 35 day DMA | 6.85 | | 50 day DMA | 6.68 | | 100 day DMA | 6.8 | | 150 day DMA | 7.34 | | 200 day DMA | 8.52 | EMA (exponential moving average) of Piedmont Lithium PLL
| EMA period | EMA current | EMA prev | EMA prev2 | | 5 day EMA | 7.44 | 7.53 | 7.65 | | 12 day EMA | 7.56 | 7.61 | 7.67 | | 20 day EMA | 7.41 | 7.43 | 7.44 | | 35 day EMA | 7.15 | 7.14 | 7.13 | | 50 day EMA | 6.74 | 6.72 | 6.7 |
SMA (simple moving average) of Piedmont Lithium PLL
| SMA period | SMA current | SMA prev | SMA prev2 | | 5 day SMA | 7.37 | 7.55 | 7.81 | | 12 day SMA | 7.91 | 7.92 | 7.93 | | 20 day SMA | 7.49 | 7.45 | 7.42 | | 35 day SMA | 6.85 | 6.82 | 6.79 | | 50 day SMA | 6.68 | 6.66 | 6.65 | | 100 day SMA | 6.8 | 6.8 | 6.8 | | 150 day SMA | 7.34 | 7.35 | 7.36 | | 200 day SMA | 8.52 | 8.53 | 8.55 |
|
|
