PanhandleRoyalty PHX full analysis,charts,indicators,moving averages,SMA,DMA,EMA,ADX,MACD,RSIPanhandle Royalty PHX WideScreen charts, DMA,SMA,EMA technical analysis, forecast prediction, by indicators ADX,MACD,RSI,CCI USA stock exchange
operates under Energy sector & deals in Oil Gas Production
Daily price and charts and targets PanhandleRoyalty Strong Daily Stock price targets for PanhandleRoyalty PHX are 4.31 and 4.33 | Daily Target 1 | 4.3 | | Daily Target 2 | 4.31 | | Daily Target 3 | 4.32 | | Daily Target 4 | 4.33 | | Daily Target 5 | 4.34 |
Daily price and volume Panhandle Royalty
| Date |
Closing |
Open |
Range |
Volume |
Thu 29 May 2025 |
4.32 (0%) |
4.32 |
4.31 - 4.33 |
0.7435 times |
Wed 28 May 2025 |
4.32 (0.23%) |
4.31 |
4.31 - 4.32 |
0.6164 times |
Tue 27 May 2025 |
4.31 (0%) |
4.31 |
4.31 - 4.32 |
2.2082 times |
Fri 23 May 2025 |
4.31 (0%) |
4.32 |
4.31 - 4.32 |
1.2407 times |
Thu 22 May 2025 |
4.31 (-0.23%) |
4.31 |
4.31 - 4.33 |
3.2089 times |
Wed 21 May 2025 |
4.32 (0.23%) |
4.31 |
4.31 - 4.33 |
0.5452 times |
Tue 20 May 2025 |
4.31 (-0.46%) |
4.32 |
4.31 - 4.33 |
0.5334 times |
Mon 19 May 2025 |
4.33 (0%) |
4.33 |
4.33 - 4.34 |
0.444 times |
Fri 16 May 2025 |
4.33 (0.23%) |
4.32 |
4.32 - 4.34 |
0.2712 times |
Thu 15 May 2025 |
4.32 (0%) |
4.32 |
4.32 - 4.34 |
0.1884 times |
Wed 14 May 2025 |
4.32 (-0.23%) |
4.33 |
4.32 - 4.34 |
1.3742 times |
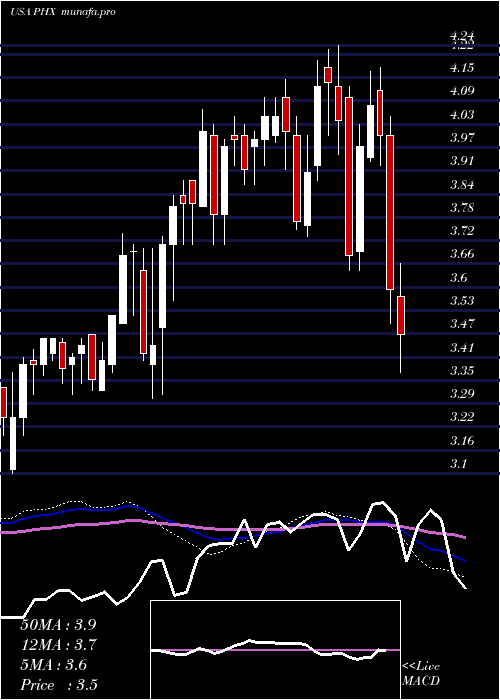
Weekly price and charts PanhandleRoyalty Strong weekly Stock price targets for PanhandleRoyalty PHX are 4.32 and 4.34 | Weekly Target 1 | 4.3 | | Weekly Target 2 | 4.31 | | Weekly Target 3 | 4.32 | | Weekly Target 4 | 4.33 | | Weekly Target 5 | 4.34 |
Weekly price and volumes for Panhandle Royalty
| Date |
Closing |
Open |
Range |
Volume |
Thu 29 May 2025 |
4.32 (0.23%) |
4.31 |
4.31 - 4.33 |
2.2057 times |
Fri 23 May 2025 |
4.31 (-0.46%) |
4.33 |
4.31 - 4.34 |
3.6918 times |
Fri 16 May 2025 |
4.33 (0%) |
4.33 |
4.32 - 4.34 |
2.2488 times |
Fri 09 May 2025 |
4.33 (10.74%) |
3.91 |
3.53 - 4.34 |
1.5634 times |
Fri 02 May 2025 |
3.91 (0.26%) |
3.93 |
3.81 - 3.98 |
0.1775 times |
Fri 25 April 2025 |
3.90 (-1.02%) |
3.76 |
3.73 - 3.96 |
0.073 times |
Thu 17 April 2025 |
3.94 (5.35%) |
3.66 |
3.60 - 3.94 |
0.0397 times |
Wed 16 April 2025 |
3.74 (0%) |
3.66 |
3.60 - 3.76 |
0 times |
Wed 16 April 2025 |
3.74 (0%) |
3.66 |
3.60 - 3.76 |
0 times |
Wed 16 April 2025 |
3.74 (0%) |
3.66 |
3.60 - 3.76 |
0 times |
Wed 16 April 2025 |
3.74 (7.78%) |
3.50 |
3.50 - 3.75 |
0.0759 times |
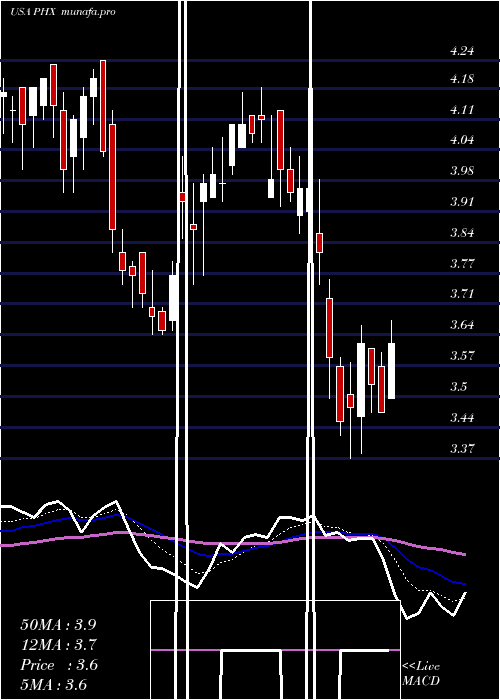
Monthly price and charts PanhandleRoyalty Strong monthly Stock price targets for PanhandleRoyalty PHX are 3.93 and 4.74 | Monthly Target 1 | 3.25 | | Monthly Target 2 | 3.79 | | Monthly Target 3 | 4.0633333333333 | | Monthly Target 4 | 4.6 | | Monthly Target 5 | 4.87 |
Monthly price and volumes Panhandle Royalty
| Date |
Closing |
Open |
Range |
Volume |
Thu 29 May 2025 |
4.32 (12.79%) |
3.83 |
3.53 - 4.34 |
6.0531 times |
Wed 30 April 2025 |
3.83 (-3.04%) |
3.90 |
3.37 - 4.03 |
0.4239 times |
Mon 31 March 2025 |
3.95 (-2.23%) |
4.10 |
3.64 - 4.18 |
0.384 times |
Fri 28 February 2025 |
4.04 (7.16%) |
3.76 |
3.73 - 4.24 |
0.4396 times |
Fri 31 January 2025 |
3.77 (-5.75%) |
4.01 |
3.75 - 4.15 |
0.764 times |
Tue 31 December 2024 |
4.00 (4.71%) |
3.81 |
3.71 - 4.07 |
0.5344 times |
Tue 26 November 2024 |
3.82 (5.82%) |
3.64 |
3.30 - 3.88 |
0.3121 times |
Thu 31 October 2024 |
3.61 (6.8%) |
3.38 |
3.32 - 3.74 |
0.4259 times |
Mon 30 September 2024 |
3.38 (-2.31%) |
3.45 |
3.31 - 3.47 |
0.2772 times |
Fri 30 August 2024 |
3.46 (5.49%) |
3.26 |
3.10 - 3.46 |
0.3859 times |
Wed 31 July 2024 |
3.28 (0.61%) |
3.29 |
3.18 - 3.38 |
0.258 times |

DMA SMA EMA moving averages of Panhandle Royalty PHX
DMA (daily moving average) of Panhandle Royalty PHX
| DMA period | DMA value | | 5 day DMA | 4.31 | | 12 day DMA | 4.32 | | 20 day DMA | 4.14 | | 35 day DMA | 4 | | 50 day DMA | 3.94 | | 100 day DMA | 3.96 | | 150 day DMA | 3.88 | | 200 day DMA | 3.76 | EMA (exponential moving average) of Panhandle Royalty PHX
| EMA period | EMA current | EMA prev | EMA prev2 | | 5 day EMA | 4.31 | 4.31 | 4.3 | | 12 day EMA | 4.26 | 4.25 | 4.24 | | 20 day EMA | 4.19 | 4.18 | 4.16 | | 35 day EMA | 4.08 | 4.07 | 4.06 | | 50 day EMA | 3.97 | 3.96 | 3.95 |
SMA (simple moving average) of Panhandle Royalty PHX
| SMA period | SMA current | SMA prev | SMA prev2 | | 5 day SMA | 4.31 | 4.31 | 4.31 | | 12 day SMA | 4.32 | 4.32 | 4.32 | | 20 day SMA | 4.14 | 4.12 | 4.1 | | 35 day SMA | 4 | 3.98 | 3.95 | | 50 day SMA | 3.94 | 3.94 | 3.93 | | 100 day SMA | 3.96 | 3.95 | 3.95 | | 150 day SMA | 3.88 | 3.88 | 3.87 | | 200 day SMA | 3.76 | 3.76 | 3.75 |
|
|
