PotbellyCorporation PBPB full analysis,charts,indicators,moving averages,SMA,DMA,EMA,ADX,MACD,RSIPotbelly Corporation PBPB WideScreen charts, DMA,SMA,EMA technical analysis, forecast prediction, by indicators ADX,MACD,RSI,CCI USA stock exchange
operates under Consumer Services sector & deals in Restaurants
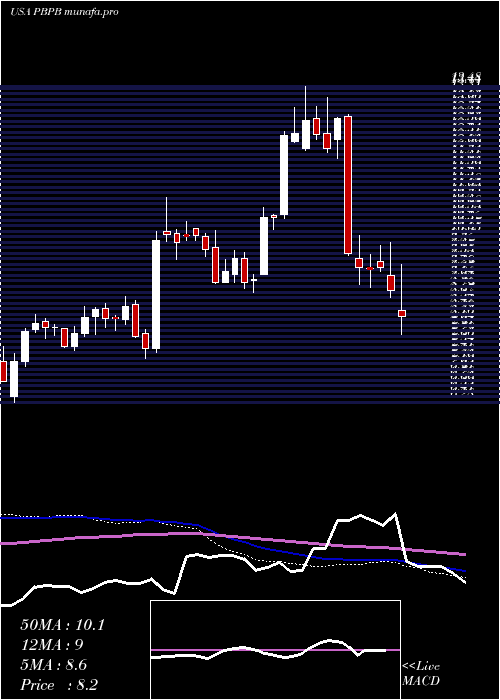
Daily price and charts and targets PotbellyCorporation Strong Daily Stock price targets for PotbellyCorporation PBPB are 16.99 and 17.01 | Daily Target 1 | 16.99 | | Daily Target 2 | 16.99 | | Daily Target 3 | 17.006666666667 | | Daily Target 4 | 17.01 | | Daily Target 5 | 17.03 |
Daily price and volume Potbelly Corporation
| Date |
Closing |
Open |
Range |
Volume |
Tue 16 September 2025 |
17.00 (-0.06%) |
17.02 |
17.00 - 17.02 |
0.2858 times |
Mon 15 September 2025 |
17.01 (0.06%) |
17.00 |
17.00 - 17.02 |
0.6713 times |
Fri 12 September 2025 |
17.00 (-0.12%) |
17.01 |
16.99 - 17.02 |
0.8454 times |
Thu 11 September 2025 |
17.02 (0.24%) |
16.99 |
16.99 - 17.02 |
1.9935 times |
Wed 10 September 2025 |
16.98 (31.32%) |
17.01 |
16.98 - 17.04 |
5.9654 times |
Tue 09 September 2025 |
12.93 (1.41%) |
12.71 |
12.53 - 12.94 |
0.0552 times |
Mon 08 September 2025 |
12.75 (0.79%) |
12.79 |
12.38 - 12.93 |
0.0435 times |
Fri 05 September 2025 |
12.65 (0.16%) |
12.67 |
12.42 - 12.76 |
0.0346 times |
Thu 04 September 2025 |
12.63 (2.1%) |
12.42 |
12.34 - 12.64 |
0.0561 times |
Wed 03 September 2025 |
12.37 (-2.37%) |
12.60 |
12.19 - 12.75 |
0.0492 times |
Tue 02 September 2025 |
12.67 (-2.09%) |
12.75 |
12.61 - 13.09 |
0.0646 times |

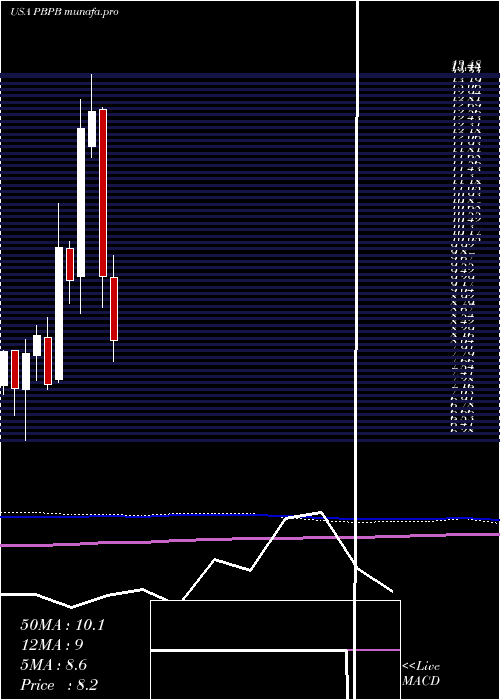
Weekly price and charts PotbellyCorporation Strong weekly Stock price targets for PotbellyCorporation PBPB are 16.99 and 17.01 | Weekly Target 1 | 16.99 | | Weekly Target 2 | 16.99 | | Weekly Target 3 | 17.006666666667 | | Weekly Target 4 | 17.01 | | Weekly Target 5 | 17.03 |
Weekly price and volumes for Potbelly Corporation
| Date |
Closing |
Open |
Range |
Volume |
Tue 16 September 2025 |
17.00 (0%) |
17.00 |
17.00 - 17.02 |
0.7712 times |
Fri 12 September 2025 |
17.00 (34.39%) |
12.79 |
12.38 - 17.04 |
7.1743 times |
Fri 05 September 2025 |
12.65 (-2.24%) |
12.75 |
12.19 - 13.09 |
0.1647 times |
Fri 29 August 2025 |
12.94 (0%) |
13.06 |
12.81 - 13.11 |
0.0347 times |
Fri 29 August 2025 |
12.94 (1.57%) |
12.73 |
12.49 - 13.18 |
0.2774 times |
Fri 22 August 2025 |
12.74 (1.76%) |
12.45 |
11.91 - 12.88 |
0.2291 times |
Fri 15 August 2025 |
12.52 (-0.24%) |
12.53 |
12.14 - 12.99 |
0.2691 times |
Fri 08 August 2025 |
12.55 (9.32%) |
11.62 |
10.83 - 13.67 |
0.4273 times |
Fri 01 August 2025 |
11.48 (-8.6%) |
12.58 |
11.31 - 12.71 |
0.2973 times |
Fri 25 July 2025 |
12.56 (1.13%) |
12.54 |
12.42 - 13.10 |
0.3548 times |
Fri 18 July 2025 |
12.42 (-1.74%) |
12.65 |
12.34 - 12.86 |
0.2552 times |
Monthly price and charts PotbellyCorporation Strong monthly Stock price targets for PotbellyCorporation PBPB are 14.6 and 19.45 | Monthly Target 1 | 10.56 | | Monthly Target 2 | 13.78 | | Monthly Target 3 | 15.41 | | Monthly Target 4 | 18.63 | | Monthly Target 5 | 20.26 |
Monthly price and volumes Potbelly Corporation
| Date |
Closing |
Open |
Range |
Volume |
Tue 16 September 2025 |
17.00 (31.38%) |
12.75 |
12.19 - 17.04 |
4.3138 times |
Fri 29 August 2025 |
12.94 (7.56%) |
11.85 |
10.83 - 13.67 |
0.6912 times |
Thu 31 July 2025 |
12.03 (-1.8%) |
12.20 |
11.82 - 13.10 |
0.6855 times |
Mon 30 June 2025 |
12.25 (14.81%) |
10.67 |
10.32 - 12.37 |
0.6231 times |
Fri 30 May 2025 |
10.67 (31.73%) |
8.10 |
8.06 - 10.80 |
0.5481 times |
Wed 30 April 2025 |
8.10 (-14.83%) |
9.48 |
7.60 - 9.91 |
0.7821 times |
Mon 31 March 2025 |
9.51 (-25.41%) |
12.79 |
8.89 - 12.84 |
0.9121 times |
Fri 28 February 2025 |
12.75 (2.74%) |
12.06 |
11.84 - 13.48 |
0.5846 times |
Fri 31 January 2025 |
12.41 (31.74%) |
9.50 |
8.78 - 12.99 |
0.6139 times |
Tue 31 December 2024 |
9.42 (-6.55%) |
10.06 |
8.98 - 10.19 |
0.2456 times |
Tue 26 November 2024 |
10.08 (36.59%) |
7.47 |
7.41 - 10.94 |
0.4405 times |
DMA SMA EMA moving averages of Potbelly Corporation PBPB
DMA (daily moving average) of Potbelly Corporation PBPB
| DMA period | DMA value | | 5 day DMA | 17 | | 12 day DMA | 14.5 | | 20 day DMA | 13.79 | | 35 day DMA | 13.13 | | 50 day DMA | 12.97 | | 100 day DMA | 11.68 | | 150 day DMA | 11.17 | | 200 day DMA | 10.98 | EMA (exponential moving average) of Potbelly Corporation PBPB
| EMA period | EMA current | EMA prev | EMA prev2 | | 5 day EMA | 16.45 | 16.17 | 15.75 | | 12 day EMA | 15.14 | 14.8 | 14.4 | | 20 day EMA | 14.37 | 14.09 | 13.78 | | 35 day EMA | 13.69 | 13.5 | 13.29 | | 50 day EMA | 13.33 | 13.18 | 13.02 |
SMA (simple moving average) of Potbelly Corporation PBPB
| SMA period | SMA current | SMA prev | SMA prev2 | | 5 day SMA | 17 | 16.19 | 15.34 | | 12 day SMA | 14.5 | 14.16 | 13.83 | | 20 day SMA | 13.79 | 13.55 | 13.32 | | 35 day SMA | 13.13 | 12.99 | 12.86 | | 50 day SMA | 12.97 | 12.88 | 12.8 | | 100 day SMA | 11.68 | 11.59 | 11.5 | | 150 day SMA | 11.17 | 11.14 | 11.11 | | 200 day SMA | 10.98 | 10.95 | 10.91 |
|
|
