OfficeProperties OPI full analysis,charts,indicators,moving averages,SMA,DMA,EMA,ADX,MACD,RSIOffice Properties OPI WideScreen charts, DMA,SMA,EMA technical analysis, forecast prediction, by indicators ADX,MACD,RSI,CCI USA stock exchange
operates under Finance sector & deals in Real Estate
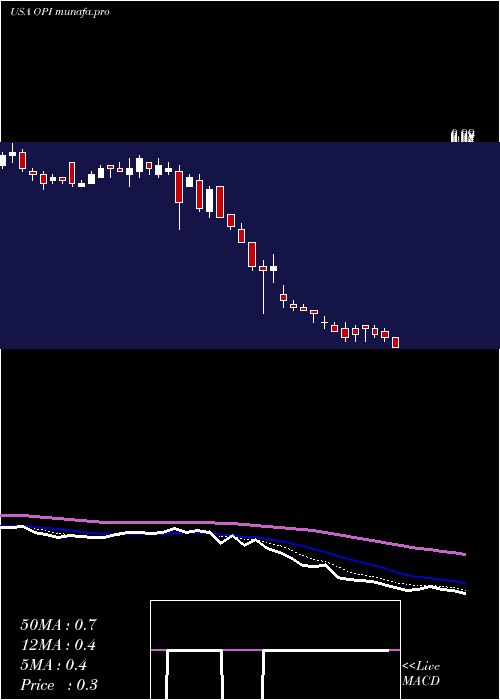
Daily price and charts and targets OfficeProperties Strong Daily Stock price targets for OfficeProperties OPI are 0.41 and 0.71 | Daily Target 1 | 0.36 | | Daily Target 2 | 0.46 | | Daily Target 3 | 0.65666666666667 | | Daily Target 4 | 0.76 | | Daily Target 5 | 0.96 |
Daily price and volume Office Properties
| Date |
Closing |
Open |
Range |
Volume |
Wed 17 September 2025 |
0.57 (-31.33%) |
0.77 |
0.55 - 0.85 |
0.6228 times |
Tue 16 September 2025 |
0.83 (-5.68%) |
1.06 |
0.75 - 1.13 |
1.2193 times |
Mon 15 September 2025 |
0.88 (60%) |
0.71 |
0.65 - 0.99 |
2.4758 times |
Fri 12 September 2025 |
0.55 (77.42%) |
0.42 |
0.36 - 0.78 |
5.3879 times |
Thu 11 September 2025 |
0.31 (24%) |
0.27 |
0.25 - 0.31 |
0.2252 times |
Wed 10 September 2025 |
0.25 (8.7%) |
0.23 |
0.22 - 0.25 |
0.0185 times |
Tue 09 September 2025 |
0.23 (-4.17%) |
0.24 |
0.23 - 0.24 |
0.0078 times |
Mon 08 September 2025 |
0.24 (4.35%) |
0.23 |
0.23 - 0.24 |
0.0133 times |
Fri 05 September 2025 |
0.23 (4.55%) |
0.23 |
0.21 - 0.24 |
0.0149 times |
Thu 04 September 2025 |
0.22 (15.79%) |
0.21 |
0.20 - 0.22 |
0.0145 times |
Wed 03 September 2025 |
0.19 (-9.52%) |
0.22 |
0.19 - 0.22 |
0.0133 times |
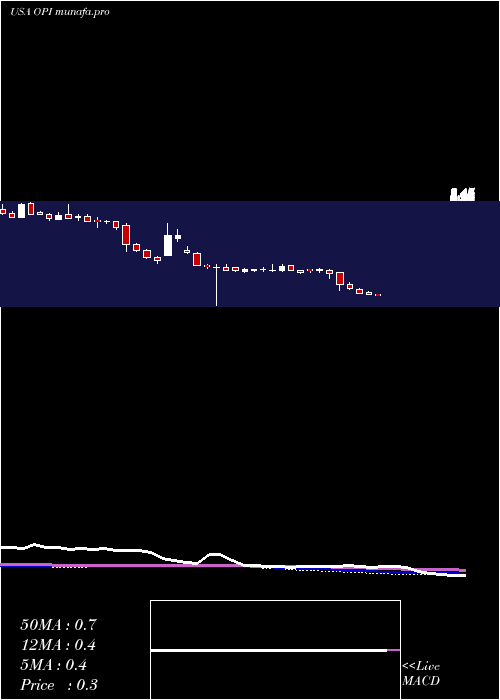
Weekly price and charts OfficeProperties Strong weekly Stock price targets for OfficeProperties OPI are 0.27 and 0.85 | Weekly Target 1 | 0.17 | | Weekly Target 2 | 0.37 | | Weekly Target 3 | 0.75 | | Weekly Target 4 | 0.95 | | Weekly Target 5 | 1.33 |
Weekly price and volumes for Office Properties
| Date |
Closing |
Open |
Range |
Volume |
Wed 17 September 2025 |
0.57 (3.64%) |
0.71 |
0.55 - 1.13 |
4.1398 times |
Fri 12 September 2025 |
0.55 (139.13%) |
0.23 |
0.22 - 0.78 |
5.4194 times |
Fri 05 September 2025 |
0.23 (9.52%) |
0.22 |
0.19 - 0.24 |
0.0472 times |
Fri 29 August 2025 |
0.21 (0%) |
0.23 |
0.21 - 0.23 |
0.0083 times |
Fri 29 August 2025 |
0.21 (-4.55%) |
0.23 |
0.21 - 0.24 |
0.0695 times |
Fri 22 August 2025 |
0.22 (-8.33%) |
0.24 |
0.22 - 0.24 |
0.0449 times |
Fri 15 August 2025 |
0.24 (4.35%) |
0.24 |
0.23 - 0.25 |
0.0305 times |
Fri 08 August 2025 |
0.23 (0%) |
0.23 |
0.23 - 0.25 |
0.0224 times |
Fri 01 August 2025 |
0.23 (-17.86%) |
0.28 |
0.22 - 0.29 |
0.0895 times |
Fri 25 July 2025 |
0.28 (16.67%) |
0.24 |
0.24 - 0.33 |
0.1286 times |
Fri 18 July 2025 |
0.24 (-14.29%) |
0.28 |
0.23 - 0.29 |
0.0436 times |
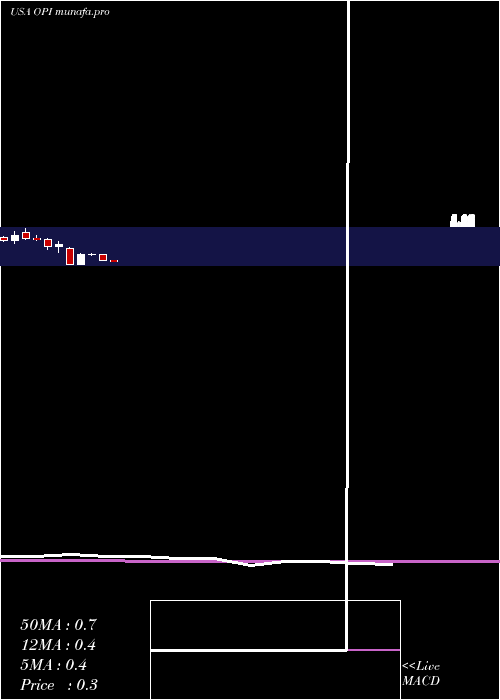
Monthly price and charts OfficeProperties Strong monthly Stock price targets for OfficeProperties OPI are 0.38 and 1.32 | Monthly Target 1 | -0.31 | | Monthly Target 2 | 0.13 | | Monthly Target 3 | 0.63 | | Monthly Target 4 | 1.07 | | Monthly Target 5 | 1.57 |
Monthly price and volumes Office Properties
| Date |
Closing |
Open |
Range |
Volume |
Wed 17 September 2025 |
0.57 (171.43%) |
0.22 |
0.19 - 1.13 |
7.9761 times |
Fri 29 August 2025 |
0.21 (-12.5%) |
0.24 |
0.21 - 0.25 |
0.1599 times |
Thu 31 July 2025 |
0.24 (-4%) |
0.25 |
0.23 - 0.34 |
0.2951 times |
Mon 30 June 2025 |
0.25 (31.58%) |
0.21 |
0.18 - 0.30 |
0.3221 times |
Fri 30 May 2025 |
0.19 (-53.66%) |
0.39 |
0.18 - 0.39 |
0.3359 times |
Wed 30 April 2025 |
0.41 (-10.87%) |
0.46 |
0.32 - 0.47 |
0.1749 times |
Mon 31 March 2025 |
0.46 (-49.45%) |
0.91 |
0.44 - 0.95 |
0.2723 times |
Fri 28 February 2025 |
0.91 (0%) |
0.90 |
0.84 - 1.05 |
0.1067 times |
Fri 31 January 2025 |
0.91 (810%) |
0.10 |
0.10 - 1.04 |
0.1626 times |
Tue 31 December 2024 |
0.10 (-94.19%) |
1.38 |
0.10 - 1.46 |
0.1945 times |
Tue 26 November 2024 |
1.72 (8.18%) |
1.56 |
1.06 - 1.99 |
0.489 times |
DMA SMA EMA moving averages of Office Properties OPI
DMA (daily moving average) of Office Properties OPI
| DMA period | DMA value | | 5 day DMA | 0.63 | | 12 day DMA | 0.39 | | 20 day DMA | 0.32 | | 35 day DMA | 0.28 | | 50 day DMA | 0.28 | | 100 day DMA | 0.27 | | 150 day DMA | 0.4 | | 200 day DMA | 0.56 | EMA (exponential moving average) of Office Properties OPI
| EMA period | EMA current | EMA prev | EMA prev2 | | 5 day EMA | 0.61 | 0.63 | 0.53 | | 12 day EMA | 0.47 | 0.45 | 0.38 | | 20 day EMA | 0.42 | 0.4 | 0.35 | | 35 day EMA | 0.35 | 0.34 | 0.31 | | 50 day EMA | 0.31 | 0.3 | 0.28 |
SMA (simple moving average) of Office Properties OPI
| SMA period | SMA current | SMA prev | SMA prev2 | | 5 day SMA | 0.63 | 0.56 | 0.44 | | 12 day SMA | 0.39 | 0.36 | 0.31 | | 20 day SMA | 0.32 | 0.3 | 0.27 | | 35 day SMA | 0.28 | 0.28 | 0.26 | | 50 day SMA | 0.28 | 0.27 | 0.26 | | 100 day SMA | 0.27 | 0.26 | 0.26 | | 150 day SMA | 0.4 | 0.4 | 0.4 | | 200 day SMA | 0.56 | 0.56 | 0.56 |
|
|
