OfficeDepot ODP full analysis,charts,indicators,moving averages,SMA,DMA,EMA,ADX,MACD,RSIOffice Depot ODP WideScreen charts, DMA,SMA,EMA technical analysis, forecast prediction, by indicators ADX,MACD,RSI,CCI USA stock exchange
operates under Consumer Services sector & deals in Other Specialty Stores
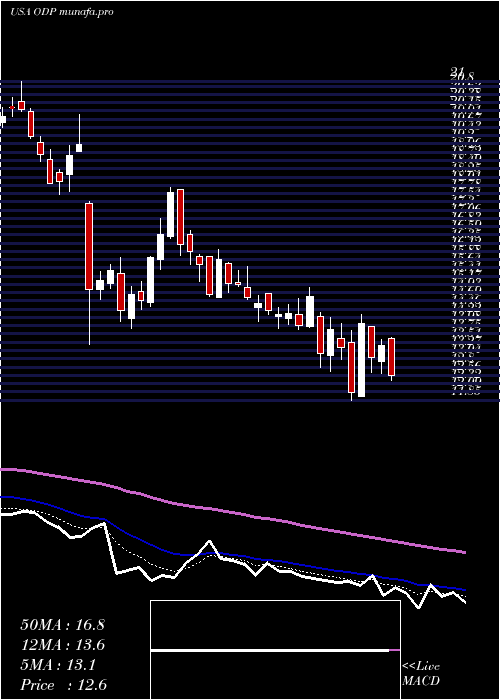
Daily price and charts and targets OfficeDepot Strong Daily Stock price targets for OfficeDepot ODP are 27.86 and 27.89 | Daily Target 1 | 27.85 | | Daily Target 2 | 27.87 | | Daily Target 3 | 27.883333333333 | | Daily Target 4 | 27.9 | | Daily Target 5 | 27.91 |
Daily price and volume Office Depot
| Date |
Closing |
Open |
Range |
Volume |
Wed 19 November 2025 |
27.88 (0.07%) |
27.89 |
27.87 - 27.90 |
0.7696 times |
Tue 18 November 2025 |
27.86 (0.04%) |
27.87 |
27.84 - 27.88 |
1.4192 times |
Mon 17 November 2025 |
27.85 (-0.07%) |
27.88 |
27.85 - 27.90 |
1.2105 times |
Fri 14 November 2025 |
27.87 (0.07%) |
27.87 |
27.85 - 27.90 |
1.113 times |
Thu 13 November 2025 |
27.85 (-0.07%) |
27.90 |
27.85 - 27.90 |
0.8742 times |
Wed 12 November 2025 |
27.87 (-0.04%) |
27.90 |
27.87 - 27.92 |
0.7554 times |
Tue 11 November 2025 |
27.88 (0.04%) |
27.85 |
27.85 - 27.91 |
0.7943 times |
Mon 10 November 2025 |
27.87 (0.07%) |
27.88 |
27.84 - 27.89 |
0.8602 times |
Fri 07 November 2025 |
27.85 (0.04%) |
27.91 |
27.84 - 27.91 |
1.4654 times |
Thu 06 November 2025 |
27.84 (-0.18%) |
27.85 |
27.84 - 27.92 |
0.7382 times |
Wed 05 November 2025 |
27.89 (0.32%) |
27.83 |
27.82 - 27.92 |
0.8462 times |
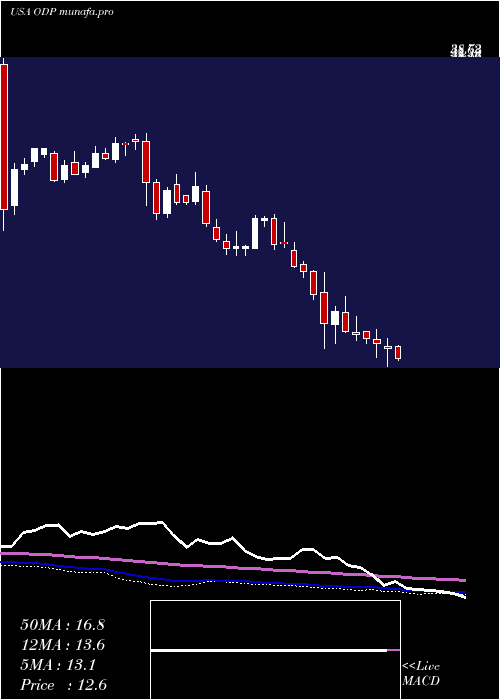
Weekly price and charts OfficeDepot Strong weekly Stock price targets for OfficeDepot ODP are 27.85 and 27.91 | Weekly Target 1 | 27.81 | | Weekly Target 2 | 27.85 | | Weekly Target 3 | 27.873333333333 | | Weekly Target 4 | 27.91 | | Weekly Target 5 | 27.93 |
Weekly price and volumes for Office Depot
| Date |
Closing |
Open |
Range |
Volume |
Wed 19 November 2025 |
27.88 (0.04%) |
27.88 |
27.84 - 27.90 |
0.6731 times |
Fri 14 November 2025 |
27.87 (0.07%) |
27.88 |
27.84 - 27.92 |
0.8707 times |
Fri 07 November 2025 |
27.85 (-0.11%) |
27.84 |
27.80 - 27.92 |
0.7497 times |
Fri 31 October 2025 |
27.88 (0%) |
27.80 |
27.79 - 27.92 |
0.1558 times |
Fri 31 October 2025 |
27.88 (0.43%) |
27.81 |
27.76 - 27.92 |
0.9796 times |
Fri 24 October 2025 |
27.76 (0%) |
27.80 |
27.75 - 27.83 |
0.6533 times |
Fri 17 October 2025 |
27.76 (0.14%) |
27.79 |
27.68 - 27.97 |
0.6542 times |
Fri 10 October 2025 |
27.72 (-0.54%) |
27.84 |
27.65 - 27.87 |
1.4906 times |
Fri 03 October 2025 |
27.87 (-0.39%) |
27.98 |
27.80 - 27.98 |
0.9791 times |
Fri 26 September 2025 |
27.98 (34.39%) |
27.73 |
27.61 - 28.04 |
2.7938 times |
Fri 19 September 2025 |
20.82 (0.43%) |
20.35 |
20.05 - 22.61 |
0.5662 times |
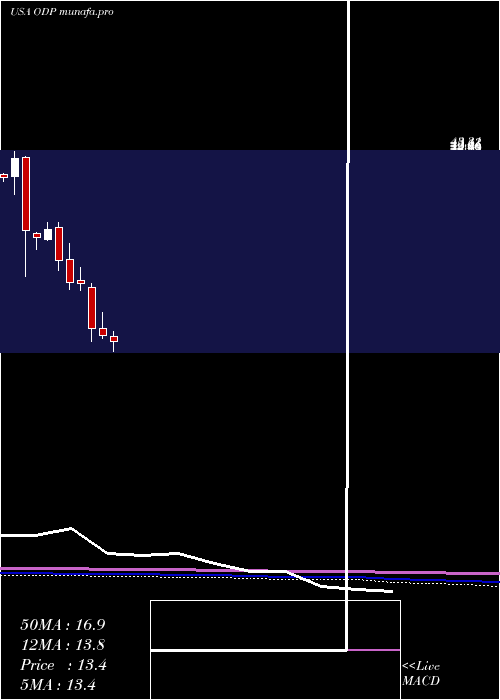
Monthly price and charts OfficeDepot Strong monthly Stock price targets for OfficeDepot ODP are 27.84 and 27.96 | Monthly Target 1 | 27.75 | | Monthly Target 2 | 27.81 | | Monthly Target 3 | 27.866666666667 | | Monthly Target 4 | 27.93 | | Monthly Target 5 | 27.99 |
Monthly price and volumes Office Depot
| Date |
Closing |
Open |
Range |
Volume |
Wed 19 November 2025 |
27.88 (0%) |
27.84 |
27.80 - 27.92 |
0.8373 times |
Fri 31 October 2025 |
27.88 (0.11%) |
27.89 |
27.65 - 27.97 |
1.6281 times |
Tue 30 September 2025 |
27.85 (37.46%) |
19.90 |
19.52 - 28.04 |
1.6509 times |
Fri 29 August 2025 |
20.26 (13.57%) |
17.68 |
16.55 - 21.92 |
0.6792 times |
Thu 31 July 2025 |
17.84 (-1.6%) |
18.05 |
16.82 - 20.04 |
0.6605 times |
Mon 30 June 2025 |
18.13 (10.21%) |
16.42 |
16.08 - 18.78 |
0.6439 times |
Fri 30 May 2025 |
16.45 (20.25%) |
13.83 |
13.57 - 19.65 |
0.7832 times |
Wed 30 April 2025 |
13.68 (-4.54%) |
14.31 |
11.85 - 15.07 |
1.4322 times |
Mon 31 March 2025 |
14.33 (-7.9%) |
15.48 |
13.89 - 17.95 |
0.9326 times |
Fri 28 February 2025 |
15.56 (-31.15%) |
22.01 |
13.44 - 22.65 |
0.7522 times |
Fri 31 January 2025 |
22.60 (-0.62%) |
23.02 |
21.52 - 25.16 |
0.6445 times |
DMA SMA EMA moving averages of Office Depot ODP
DMA (daily moving average) of Office Depot ODP
| DMA period | DMA value | | 5 day DMA | 27.86 | | 12 day DMA | 27.86 | | 20 day DMA | 27.84 | | 35 day DMA | 27.82 | | 50 day DMA | 26.9 | | 100 day DMA | 23.18 | | 150 day DMA | 20.85 | | 200 day DMA | 19.71 | EMA (exponential moving average) of Office Depot ODP
| EMA period | EMA current | EMA prev | EMA prev2 | | 5 day EMA | 27.87 | 27.86 | 27.86 | | 12 day EMA | 27.85 | 27.84 | 27.84 | | 20 day EMA | 27.73 | 27.71 | 27.69 | | 35 day EMA | 27.12 | 27.07 | 27.02 | | 50 day EMA | 26.53 | 26.47 | 26.41 |
SMA (simple moving average) of Office Depot ODP
| SMA period | SMA current | SMA prev | SMA prev2 | | 5 day SMA | 27.86 | 27.86 | 27.86 | | 12 day SMA | 27.86 | 27.86 | 27.86 | | 20 day SMA | 27.84 | 27.83 | 27.83 | | 35 day SMA | 27.82 | 27.82 | 27.82 | | 50 day SMA | 26.9 | 26.75 | 26.6 | | 100 day SMA | 23.18 | 23.08 | 22.98 | | 150 day SMA | 20.85 | 20.75 | 20.65 | | 200 day SMA | 19.71 | 19.69 | 19.66 |
|
|
