NewYork NYMTN full analysis,charts,indicators,moving averages,SMA,DMA,EMA,ADX,MACD,RSINew York NYMTN WideScreen charts, DMA,SMA,EMA technical analysis, forecast prediction, by indicators ADX,MACD,RSI,CCI USA stock exchange
operates under Consumer Services sector & deals in Real Estate Investment Trusts
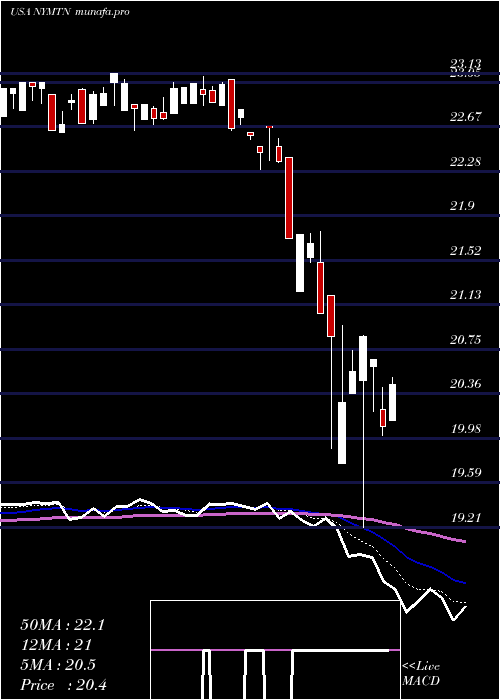
Daily price and charts and targets NewYork Strong Daily Stock price targets for NewYork NYMTN are 21.62 and 21.93 | Daily Target 1 | 21.37 | | Daily Target 2 | 21.56 | | Daily Target 3 | 21.683333333333 | | Daily Target 4 | 21.87 | | Daily Target 5 | 21.99 |
Daily price and volume New York
| Date |
Closing |
Open |
Range |
Volume |
Fri 01 August 2025 |
21.74 (0.05%) |
21.50 |
21.50 - 21.81 |
0.4302 times |
Thu 31 July 2025 |
21.73 (0.74%) |
21.65 |
21.45 - 21.77 |
7.6948 times |
Wed 30 July 2025 |
21.57 (-0.32%) |
21.60 |
21.56 - 21.71 |
0.1339 times |
Tue 29 July 2025 |
21.64 (0.09%) |
21.62 |
21.62 - 21.84 |
0.3856 times |
Mon 28 July 2025 |
21.62 (0.05%) |
21.61 |
21.51 - 21.80 |
0.1055 times |
Fri 25 July 2025 |
21.61 (0%) |
21.61 |
21.60 - 21.69 |
0.0974 times |
Thu 24 July 2025 |
21.61 (0.46%) |
21.50 |
21.50 - 21.66 |
0.2476 times |
Wed 23 July 2025 |
21.51 (-0.32%) |
21.71 |
21.51 - 21.71 |
0.1623 times |
Tue 22 July 2025 |
21.58 (0.09%) |
21.56 |
21.51 - 21.63 |
0.5032 times |
Mon 21 July 2025 |
21.56 (0.05%) |
21.66 |
21.54 - 21.66 |
0.2394 times |
Fri 18 July 2025 |
21.55 (0.05%) |
21.54 |
21.54 - 21.73 |
0.1921 times |
Weekly price and charts NewYork Strong weekly Stock price targets for NewYork NYMTN are 21.6 and 21.99 | Weekly Target 1 | 21.29 | | Weekly Target 2 | 21.51 | | Weekly Target 3 | 21.676666666667 | | Weekly Target 4 | 21.9 | | Weekly Target 5 | 22.07 |
Weekly price and volumes for New York
| Date |
Closing |
Open |
Range |
Volume |
Fri 01 August 2025 |
21.74 (0.6%) |
21.61 |
21.45 - 21.84 |
2.8196 times |
Fri 25 July 2025 |
21.61 (0.28%) |
21.66 |
21.50 - 21.71 |
0.4028 times |
Fri 18 July 2025 |
21.55 (0.47%) |
21.45 |
21.36 - 21.80 |
1.0442 times |
Fri 11 July 2025 |
21.45 (2.48%) |
20.92 |
20.88 - 21.50 |
0.8801 times |
Thu 03 July 2025 |
20.93 (-2.42%) |
21.50 |
20.53 - 21.50 |
1.861 times |
Fri 27 June 2025 |
21.45 (0.19%) |
21.42 |
21.28 - 21.50 |
0.5532 times |
Fri 20 June 2025 |
21.41 (-0.09%) |
21.45 |
20.72 - 21.53 |
0.7729 times |
Fri 13 June 2025 |
21.43 (-0.56%) |
21.55 |
21.28 - 21.94 |
0.667 times |
Fri 06 June 2025 |
21.55 (-0.32%) |
21.75 |
21.36 - 21.85 |
0.476 times |
Fri 30 May 2025 |
21.62 (-0.37%) |
21.85 |
21.49 - 22.14 |
0.5231 times |
Fri 23 May 2025 |
21.70 (-3.04%) |
22.50 |
21.65 - 22.50 |
1.0227 times |

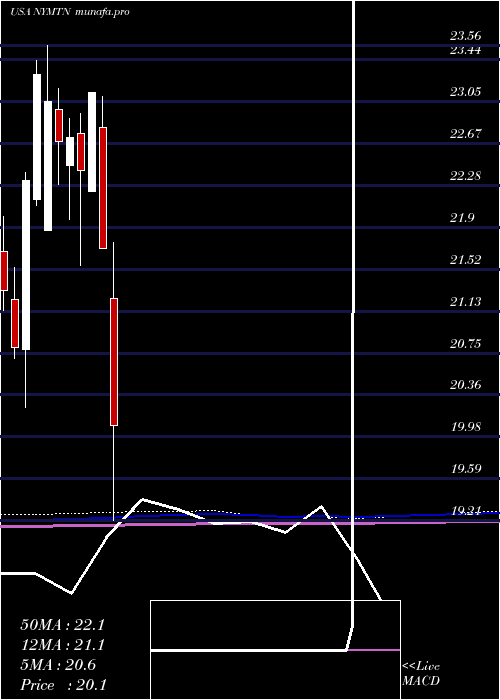
Monthly price and charts NewYork Strong monthly Stock price targets for NewYork NYMTN are 21.62 and 21.93 | Monthly Target 1 | 21.37 | | Monthly Target 2 | 21.56 | | Monthly Target 3 | 21.683333333333 | | Monthly Target 4 | 21.87 | | Monthly Target 5 | 21.99 |
Monthly price and volumes New York
| Date |
Closing |
Open |
Range |
Volume |
Fri 01 August 2025 |
21.74 (0.05%) |
21.50 |
21.50 - 21.81 |
0.0549 times |
Thu 31 July 2025 |
21.73 (4.17%) |
20.53 |
20.53 - 21.84 |
2.1645 times |
Mon 30 June 2025 |
20.86 (-3.52%) |
21.75 |
20.72 - 21.94 |
1.5335 times |
Fri 30 May 2025 |
21.62 (0.32%) |
21.41 |
21.00 - 22.60 |
0.9928 times |
Wed 30 April 2025 |
21.55 (-0.69%) |
21.25 |
19.21 - 21.76 |
1.056 times |
Mon 31 March 2025 |
21.70 (-6.18%) |
22.81 |
21.70 - 23.10 |
0.6757 times |
Fri 28 February 2025 |
23.13 (3.17%) |
22.23 |
22.23 - 23.13 |
1.0104 times |
Fri 31 January 2025 |
22.42 (-1.32%) |
22.76 |
21.55 - 22.94 |
0.9513 times |
Tue 31 December 2024 |
22.72 (0.18%) |
22.46 |
21.97 - 22.89 |
0.6903 times |
Tue 26 November 2024 |
22.68 (-1.61%) |
22.98 |
22.29 - 23.17 |
0.8706 times |
Thu 31 October 2024 |
23.05 (-1.07%) |
21.87 |
21.87 - 23.56 |
1.1347 times |
DMA SMA EMA moving averages of New York NYMTN
DMA (daily moving average) of New York NYMTN
| DMA period | DMA value | | 5 day DMA | 21.66 | | 12 day DMA | 21.61 | | 20 day DMA | 21.5 | | 35 day DMA | 21.4 | | 50 day DMA | 21.47 | | 100 day DMA | 21.53 | | 150 day DMA | 21.9 | | 200 day DMA | 22.14 | EMA (exponential moving average) of New York NYMTN
| EMA period | EMA current | EMA prev | EMA prev2 | | 5 day EMA | 21.67 | 21.64 | 21.6 | | 12 day EMA | 21.6 | 21.57 | 21.54 | | 20 day EMA | 21.55 | 21.53 | 21.51 | | 35 day EMA | 21.56 | 21.55 | 21.54 | | 50 day EMA | 21.54 | 21.53 | 21.52 |
SMA (simple moving average) of New York NYMTN
| SMA period | SMA current | SMA prev | SMA prev2 | | 5 day SMA | 21.66 | 21.63 | 21.61 | | 12 day SMA | 21.61 | 21.58 | 21.56 | | 20 day SMA | 21.5 | 21.46 | 21.42 | | 35 day SMA | 21.4 | 21.4 | 21.4 | | 50 day SMA | 21.47 | 21.47 | 21.49 | | 100 day SMA | 21.53 | 21.55 | 21.56 | | 150 day SMA | 21.9 | 21.9 | 21.91 | | 200 day SMA | 22.14 | 22.15 | 22.16 |
|
|
