NewYork NYMT full analysis,charts,indicators,moving averages,SMA,DMA,EMA,ADX,MACD,RSINew York NYMT WideScreen charts, DMA,SMA,EMA technical analysis, forecast prediction, by indicators ADX,MACD,RSI,CCI USA stock exchange
operates under Consumer Services sector & deals in Real Estate Investment Trusts
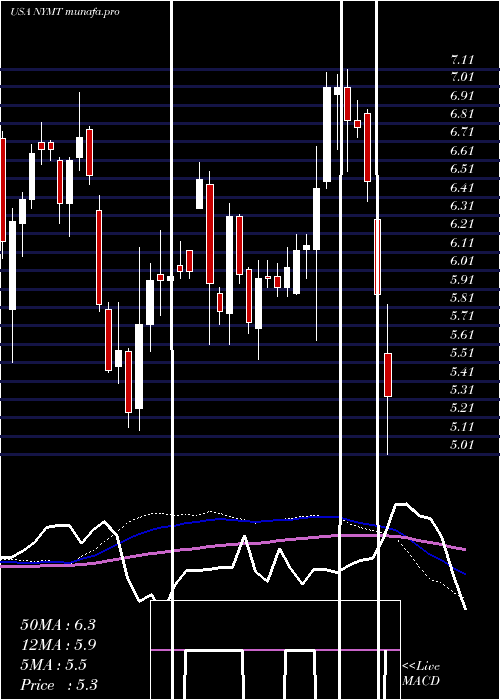
Daily price and charts and targets NewYork Strong Daily Stock price targets for NewYork NYMT are 6.62 and 6.84 | Daily Target 1 | 6.58 | | Daily Target 2 | 6.66 | | Daily Target 3 | 6.8 | | Daily Target 4 | 6.88 | | Daily Target 5 | 7.02 |
Daily price and volume New York
| Date |
Closing |
Open |
Range |
Volume |
Wed 30 July 2025 |
6.74 (-1.17%) |
6.86 |
6.72 - 6.94 |
1.3015 times |
Tue 29 July 2025 |
6.82 (0.29%) |
6.81 |
6.78 - 6.89 |
1.0256 times |
Mon 28 July 2025 |
6.80 (-3%) |
7.05 |
6.79 - 7.07 |
0.9232 times |
Fri 25 July 2025 |
7.01 (0.43%) |
6.99 |
6.88 - 7.02 |
0.9947 times |
Thu 24 July 2025 |
6.98 (0%) |
6.95 |
6.95 - 7.05 |
0.7673 times |
Wed 23 July 2025 |
6.98 (0.87%) |
6.95 |
6.91 - 7.02 |
1.3331 times |
Tue 22 July 2025 |
6.92 (2.82%) |
6.75 |
6.73 - 6.94 |
1.1805 times |
Mon 21 July 2025 |
6.73 (0.6%) |
6.73 |
6.70 - 6.79 |
0.8628 times |
Fri 18 July 2025 |
6.69 (0%) |
6.75 |
6.60 - 6.75 |
0.8128 times |
Thu 17 July 2025 |
6.69 (-1.33%) |
6.74 |
6.68 - 6.83 |
0.7984 times |
Wed 16 July 2025 |
6.78 (2.11%) |
6.64 |
6.64 - 6.79 |
1.0839 times |

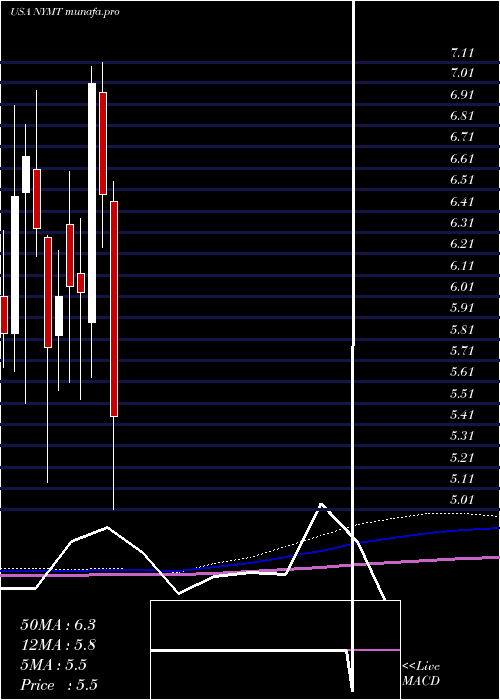
Weekly price and charts NewYork Strong weekly Stock price targets for NewYork NYMT are 6.56 and 6.91 | Weekly Target 1 | 6.49 | | Weekly Target 2 | 6.62 | | Weekly Target 3 | 6.8433333333333 | | Weekly Target 4 | 6.97 | | Weekly Target 5 | 7.19 |
Weekly price and volumes for New York
| Date |
Closing |
Open |
Range |
Volume |
Wed 30 July 2025 |
6.74 (-3.85%) |
7.05 |
6.72 - 7.07 |
0.7584 times |
Fri 25 July 2025 |
7.01 (4.78%) |
6.73 |
6.70 - 7.05 |
1.1989 times |
Fri 18 July 2025 |
6.69 (0.6%) |
6.65 |
6.60 - 6.83 |
1.074 times |
Fri 11 July 2025 |
6.65 (-2.49%) |
6.81 |
6.61 - 6.81 |
0.7649 times |
Thu 03 July 2025 |
6.82 (2.56%) |
6.65 |
6.58 - 6.89 |
0.6941 times |
Fri 27 June 2025 |
6.65 (-0.45%) |
6.52 |
6.34 - 6.67 |
1.4337 times |
Fri 20 June 2025 |
6.68 (-2.48%) |
6.74 |
6.64 - 6.83 |
1.3467 times |
Fri 13 June 2025 |
6.85 (1.18%) |
6.79 |
6.79 - 7.09 |
0.9659 times |
Fri 06 June 2025 |
6.77 (3.68%) |
6.52 |
6.36 - 6.79 |
1.0848 times |
Fri 30 May 2025 |
6.53 (1.71%) |
6.48 |
6.42 - 6.74 |
0.6787 times |
Fri 23 May 2025 |
6.42 (-9.83%) |
7.03 |
6.28 - 7.11 |
1.1139 times |
Monthly price and charts NewYork Strong monthly Stock price targets for NewYork NYMT are 6.67 and 7.14 | Monthly Target 1 | 6.33 | | Monthly Target 2 | 6.54 | | Monthly Target 3 | 6.8033333333333 | | Monthly Target 4 | 7.01 | | Monthly Target 5 | 7.27 |
Monthly price and volumes New York
| Date |
Closing |
Open |
Range |
Volume |
Wed 30 July 2025 |
6.74 (0.6%) |
6.70 |
6.60 - 7.07 |
0.7811 times |
Mon 30 June 2025 |
6.70 (2.6%) |
6.52 |
6.34 - 7.09 |
0.9204 times |
Fri 30 May 2025 |
6.53 (11.24%) |
6.49 |
6.09 - 7.27 |
1.1394 times |
Wed 30 April 2025 |
5.87 (-9.55%) |
6.46 |
5.01 - 6.55 |
1.1095 times |
Mon 31 March 2025 |
6.49 (-7.42%) |
6.97 |
6.24 - 7.11 |
0.9751 times |
Fri 28 February 2025 |
7.01 (16.25%) |
5.89 |
5.63 - 7.09 |
0.9484 times |
Fri 31 January 2025 |
6.03 (-0.5%) |
6.12 |
5.53 - 6.38 |
0.847 times |
Tue 31 December 2024 |
6.06 (0.83%) |
6.35 |
5.61 - 6.60 |
1.039 times |
Tue 26 November 2024 |
6.01 (4.16%) |
5.83 |
5.57 - 6.23 |
1.0649 times |
Thu 31 October 2024 |
5.77 (-8.85%) |
6.29 |
5.14 - 6.30 |
1.1751 times |
Mon 30 September 2024 |
6.33 (-5.1%) |
6.61 |
6.20 - 6.98 |
0.7025 times |
DMA SMA EMA moving averages of New York NYMT
DMA (daily moving average) of New York NYMT
| DMA period | DMA value | | 5 day DMA | 6.87 | | 12 day DMA | 6.82 | | 20 day DMA | 6.78 | | 35 day DMA | 6.75 | | 50 day DMA | 6.72 | | 100 day DMA | 6.48 | | 150 day DMA | 6.36 | | 200 day DMA | 6.23 | EMA (exponential moving average) of New York NYMT
| EMA period | EMA current | EMA prev | EMA prev2 | | 5 day EMA | 6.83 | 6.87 | 6.89 | | 12 day EMA | 6.82 | 6.83 | 6.83 | | 20 day EMA | 6.78 | 6.78 | 6.78 | | 35 day EMA | 6.76 | 6.76 | 6.76 | | 50 day EMA | 6.74 | 6.74 | 6.74 |
SMA (simple moving average) of New York NYMT
| SMA period | SMA current | SMA prev | SMA prev2 | | 5 day SMA | 6.87 | 6.92 | 6.94 | | 12 day SMA | 6.82 | 6.81 | 6.8 | | 20 day SMA | 6.78 | 6.78 | 6.77 | | 35 day SMA | 6.75 | 6.75 | 6.75 | | 50 day SMA | 6.72 | 6.73 | 6.74 | | 100 day SMA | 6.48 | 6.48 | 6.48 | | 150 day SMA | 6.36 | 6.36 | 6.35 | | 200 day SMA | 6.23 | 6.23 | 6.23 |
|
|
