NuveenInsured NXC full analysis,charts,indicators,moving averages,SMA,DMA,EMA,ADX,MACD,RSINuveen Insured NXC WideScreen charts, DMA,SMA,EMA technical analysis, forecast prediction, by indicators ADX,MACD,RSI,CCI USA stock exchange
operates under N A sector & deals in N A
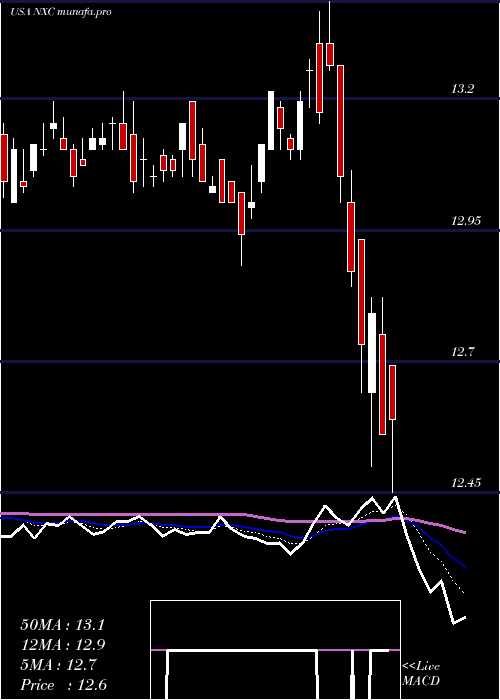
Daily price and charts and targets NuveenInsured Strong Daily Stock price targets for NuveenInsured NXC are 13.21 and 13.31 | Daily Target 1 | 13.14 | | Daily Target 2 | 13.17 | | Daily Target 3 | 13.236666666667 | | Daily Target 4 | 13.27 | | Daily Target 5 | 13.34 |
Daily price and volume Nuveen Insured
| Date |
Closing |
Open |
Range |
Volume |
Wed 19 November 2025 |
13.21 (-0.23%) |
13.20 |
13.20 - 13.30 |
0.3145 times |
Tue 18 November 2025 |
13.24 (-0.08%) |
13.20 |
13.20 - 13.29 |
0.2654 times |
Mon 17 November 2025 |
13.25 (-0.3%) |
13.30 |
13.25 - 13.30 |
0.1867 times |
Fri 14 November 2025 |
13.29 (-0.15%) |
13.26 |
13.25 - 13.32 |
1.0565 times |
Thu 13 November 2025 |
13.31 (-0.22%) |
13.31 |
13.31 - 13.33 |
0.6241 times |
Wed 12 November 2025 |
13.34 (-0.15%) |
13.31 |
13.21 - 13.35 |
1.6462 times |
Tue 11 November 2025 |
13.36 (0.75%) |
13.37 |
13.32 - 13.37 |
0.113 times |
Mon 10 November 2025 |
13.26 (0.3%) |
13.18 |
13.18 - 13.30 |
0.7027 times |
Fri 07 November 2025 |
13.22 (-1.05%) |
13.30 |
13.18 - 13.35 |
1.9902 times |
Thu 06 November 2025 |
13.36 (-0.37%) |
13.40 |
13.36 - 13.45 |
3.1007 times |
Wed 05 November 2025 |
13.41 (0.45%) |
13.31 |
13.31 - 13.42 |
1.0369 times |
Weekly price and charts NuveenInsured Strong weekly Stock price targets for NuveenInsured NXC are 13.16 and 13.26 | Weekly Target 1 | 13.14 | | Weekly Target 2 | 13.17 | | Weekly Target 3 | 13.236666666667 | | Weekly Target 4 | 13.27 | | Weekly Target 5 | 13.34 |
Weekly price and volumes for Nuveen Insured
| Date |
Closing |
Open |
Range |
Volume |
Wed 19 November 2025 |
13.21 (-0.6%) |
13.30 |
13.20 - 13.30 |
0.1526 times |
Fri 14 November 2025 |
13.29 (0.53%) |
13.18 |
13.18 - 13.37 |
0.8248 times |
Fri 07 November 2025 |
13.22 (-0.08%) |
13.28 |
13.18 - 13.45 |
1.3366 times |
Fri 31 October 2025 |
13.23 (0%) |
13.10 |
13.10 - 13.23 |
0.5264 times |
Fri 31 October 2025 |
13.23 (1.38%) |
13.10 |
13.01 - 13.23 |
1.4667 times |
Fri 24 October 2025 |
13.05 (0.31%) |
13.00 |
12.96 - 13.06 |
1.5489 times |
Fri 17 October 2025 |
13.01 (-0.31%) |
13.02 |
12.98 - 13.15 |
0.6145 times |
Fri 10 October 2025 |
13.05 (0.69%) |
12.95 |
12.93 - 13.15 |
1.3797 times |
Fri 03 October 2025 |
12.96 (0.15%) |
12.94 |
12.94 - 13.04 |
0.688 times |
Fri 26 September 2025 |
12.94 (0.08%) |
12.93 |
12.87 - 13.04 |
1.4618 times |
Fri 19 September 2025 |
12.93 (-0.15%) |
12.93 |
12.92 - 13.05 |
0.8023 times |
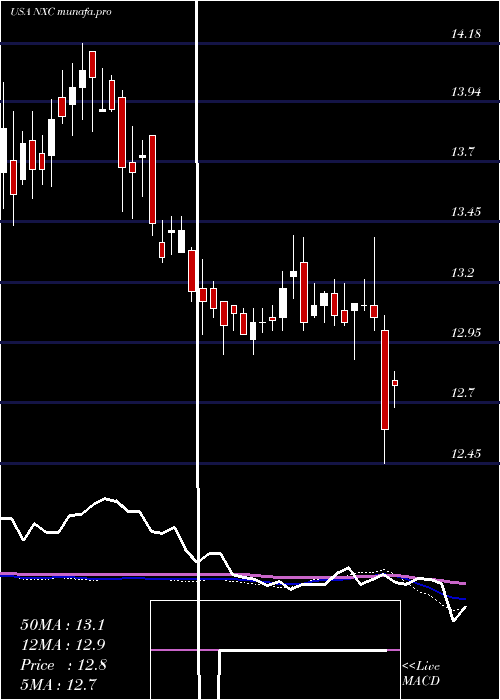
Monthly price and charts NuveenInsured Strong monthly Stock price targets for NuveenInsured NXC are 13.06 and 13.33 | Monthly Target 1 | 13.01 | | Monthly Target 2 | 13.11 | | Monthly Target 3 | 13.28 | | Monthly Target 4 | 13.38 | | Monthly Target 5 | 13.55 |
Monthly price and volumes Nuveen Insured
| Date |
Closing |
Open |
Range |
Volume |
Wed 19 November 2025 |
13.21 (-0.15%) |
13.28 |
13.18 - 13.45 |
0.5795 times |
Fri 31 October 2025 |
13.23 (1.93%) |
13.01 |
12.93 - 13.23 |
1.4962 times |
Tue 30 September 2025 |
12.98 (1.01%) |
12.83 |
12.75 - 13.05 |
1.0828 times |
Fri 29 August 2025 |
12.85 (0.16%) |
12.83 |
12.71 - 12.95 |
0.7427 times |
Thu 31 July 2025 |
12.83 (-2.58%) |
13.20 |
12.71 - 13.20 |
0.9549 times |
Mon 30 June 2025 |
13.17 (3.86%) |
12.71 |
12.68 - 13.17 |
0.8613 times |
Fri 30 May 2025 |
12.68 (-1.32%) |
12.92 |
12.66 - 13.16 |
1.0614 times |
Wed 30 April 2025 |
12.85 (-2.58%) |
13.25 |
12.41 - 13.38 |
1.5641 times |
Mon 31 March 2025 |
13.19 (0.3%) |
13.15 |
12.88 - 13.21 |
0.7276 times |
Fri 28 February 2025 |
13.15 (-0.15%) |
13.22 |
13.00 - 13.39 |
0.9296 times |
Fri 31 January 2025 |
13.17 (1.86%) |
13.00 |
12.90 - 13.24 |
1.0074 times |

DMA SMA EMA moving averages of Nuveen Insured NXC
DMA (daily moving average) of Nuveen Insured NXC
| DMA period | DMA value | | 5 day DMA | 13.26 | | 12 day DMA | 13.3 | | 20 day DMA | 13.22 | | 35 day DMA | 13.14 | | 50 day DMA | 13.09 | | 100 day DMA | 12.98 | | 150 day DMA | 12.93 | | 200 day DMA | 12.95 | EMA (exponential moving average) of Nuveen Insured NXC
| EMA period | EMA current | EMA prev | EMA prev2 | | 5 day EMA | 13.25 | 13.27 | 13.28 | | 12 day EMA | 13.25 | 13.26 | 13.26 | | 20 day EMA | 13.23 | 13.23 | 13.23 | | 35 day EMA | 13.16 | 13.16 | 13.16 | | 50 day EMA | 13.09 | 13.09 | 13.08 |
SMA (simple moving average) of Nuveen Insured NXC
| SMA period | SMA current | SMA prev | SMA prev2 | | 5 day SMA | 13.26 | 13.29 | 13.31 | | 12 day SMA | 13.3 | 13.3 | 13.3 | | 20 day SMA | 13.22 | 13.21 | 13.2 | | 35 day SMA | 13.14 | 13.13 | 13.13 | | 50 day SMA | 13.09 | 13.08 | 13.08 | | 100 day SMA | 12.98 | 12.98 | 12.97 | | 150 day SMA | 12.93 | 12.92 | 12.92 | | 200 day SMA | 12.95 | 12.95 | 12.95 |
|
|
