NanovibronixInc NAOV full analysis,charts,indicators,moving averages,SMA,DMA,EMA,ADX,MACD,RSINanovibronix Inc NAOV WideScreen charts, DMA,SMA,EMA technical analysis, forecast prediction, by indicators ADX,MACD,RSI,CCI USA stock exchange
operates under Health Care sector & deals in Industrial Specialties
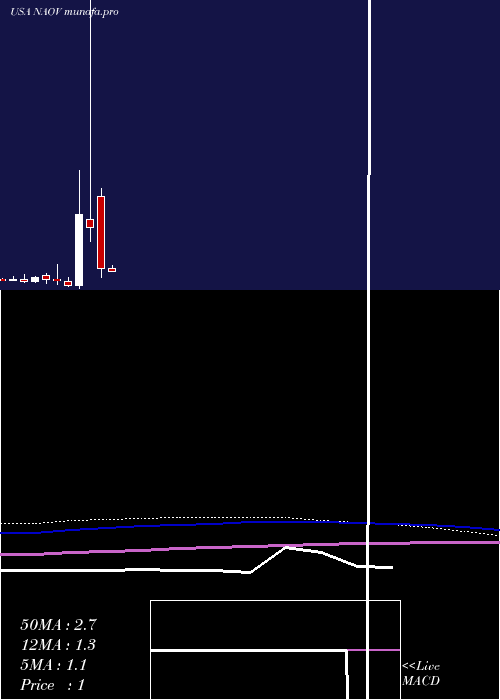
Daily price and charts and targets NanovibronixInc Strong Daily Stock price targets for NanovibronixInc NAOV are 3.65 and 3.95 | Daily Target 1 | 3.41 | | Daily Target 2 | 3.58 | | Daily Target 3 | 3.7133333333333 | | Daily Target 4 | 3.88 | | Daily Target 5 | 4.01 |
Daily price and volume Nanovibronix Inc
| Date |
Closing |
Open |
Range |
Volume |
Fri 21 November 2025 |
3.74 (-1.58%) |
3.65 |
3.55 - 3.85 |
1.0908 times |
Thu 20 November 2025 |
3.80 (-3.55%) |
3.96 |
3.80 - 4.10 |
1.2042 times |
Wed 19 November 2025 |
3.94 (-8.8%) |
4.11 |
3.87 - 4.16 |
1.4398 times |
Tue 18 November 2025 |
4.32 (-2.92%) |
4.41 |
4.20 - 4.47 |
0.7766 times |
Mon 17 November 2025 |
4.45 (0.68%) |
4.50 |
4.40 - 4.78 |
0.6283 times |
Fri 14 November 2025 |
4.42 (-5.76%) |
4.66 |
4.40 - 4.66 |
0.6021 times |
Thu 13 November 2025 |
4.69 (-2.09%) |
4.70 |
4.55 - 4.82 |
1.2565 times |
Wed 12 November 2025 |
4.79 (4.13%) |
4.70 |
4.58 - 5.10 |
1.6667 times |
Tue 11 November 2025 |
4.60 (-1.92%) |
4.59 |
4.52 - 4.64 |
0.5934 times |
Mon 10 November 2025 |
4.69 (0.86%) |
4.64 |
4.63 - 4.77 |
0.7417 times |
Fri 07 November 2025 |
4.65 (-3.12%) |
4.69 |
4.43 - 4.74 |
1.5445 times |
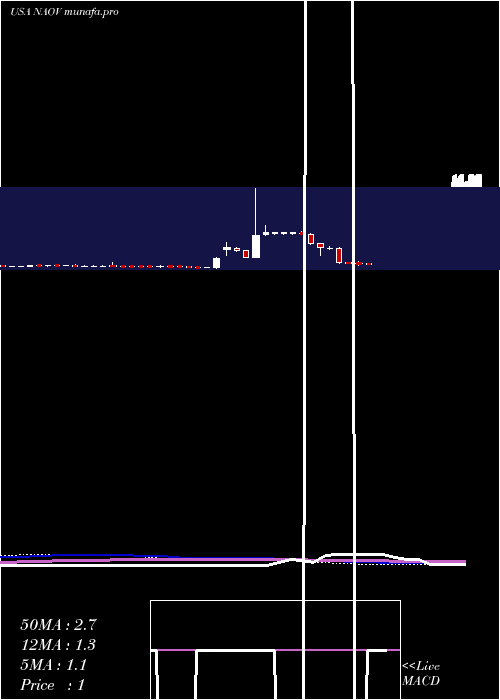
Weekly price and charts NanovibronixInc Strong weekly Stock price targets for NanovibronixInc NAOV are 3.03 and 4.26 | Weekly Target 1 | 2.79 | | Weekly Target 2 | 3.27 | | Weekly Target 3 | 4.0233333333333 | | Weekly Target 4 | 4.5 | | Weekly Target 5 | 5.25 |
Weekly price and volumes for Nanovibronix Inc
| Date |
Closing |
Open |
Range |
Volume |
Fri 21 November 2025 |
3.74 (-15.38%) |
4.50 |
3.55 - 4.78 |
0.1174 times |
Fri 14 November 2025 |
4.42 (-4.95%) |
4.64 |
4.40 - 5.10 |
0.111 times |
Fri 07 November 2025 |
4.65 (-9.53%) |
4.80 |
4.43 - 5.10 |
0.1295 times |
Fri 31 October 2025 |
5.14 (0%) |
5.29 |
5.03 - 5.42 |
0.062 times |
Fri 31 October 2025 |
5.14 (-11.38%) |
5.88 |
5.03 - 5.98 |
0.2571 times |
Fri 24 October 2025 |
5.80 (-1.36%) |
5.92 |
5.55 - 6.17 |
0.5075 times |
Fri 17 October 2025 |
5.88 (-6.96%) |
6.10 |
5.80 - 6.62 |
0.4886 times |
Fri 10 October 2025 |
6.32 (5.33%) |
6.29 |
5.98 - 7.45 |
6.2129 times |
Fri 03 October 2025 |
6.00 (-5.96%) |
6.12 |
5.47 - 6.50 |
0.8793 times |
Fri 26 September 2025 |
6.38 (-11.39%) |
7.39 |
5.82 - 7.73 |
1.2347 times |
Fri 19 September 2025 |
7.20 (10.94%) |
9.42 |
6.40 - 17.40 |
113.5543 times |
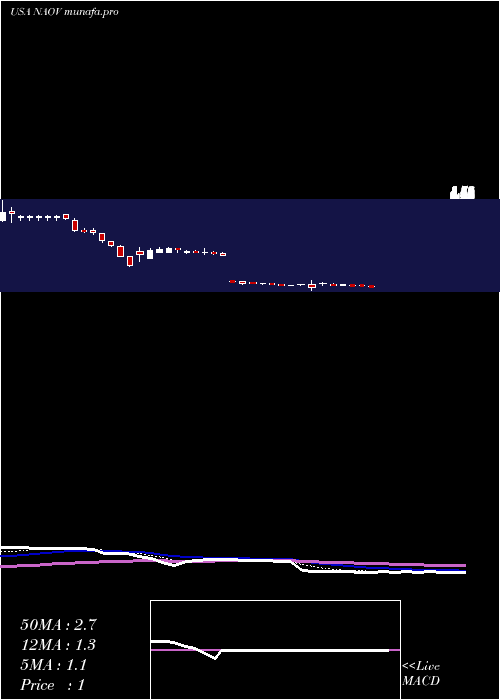
Monthly price and charts NanovibronixInc Strong monthly Stock price targets for NanovibronixInc NAOV are 2.87 and 4.42 | Monthly Target 1 | 2.58 | | Monthly Target 2 | 3.16 | | Monthly Target 3 | 4.13 | | Monthly Target 4 | 4.71 | | Monthly Target 5 | 5.68 |
Monthly price and volumes Nanovibronix Inc
| Date |
Closing |
Open |
Range |
Volume |
Fri 21 November 2025 |
3.74 (-27.24%) |
4.80 |
3.55 - 5.10 |
0.0033 times |
Fri 31 October 2025 |
5.14 (-8.87%) |
5.47 |
5.03 - 7.45 |
0.0742 times |
Tue 30 September 2025 |
5.64 (3.3%) |
5.35 |
4.71 - 17.40 |
1.0987 times |
Fri 29 August 2025 |
5.46 (557.83%) |
0.85 |
0.71 - 8.00 |
0.0613 times |
Thu 31 July 2025 |
0.83 (-10.75%) |
0.93 |
0.74 - 1.14 |
0.4068 times |
Mon 30 June 2025 |
0.93 (-12.26%) |
1.06 |
0.81 - 1.66 |
3.0085 times |
Fri 30 May 2025 |
1.06 (-62.94%) |
4.19 |
0.67 - 4.56 |
2.1615 times |
Wed 30 April 2025 |
2.86 (-16.13%) |
3.22 |
2.24 - 16.25 |
1.8512 times |
Mon 31 March 2025 |
3.41 (874.29%) |
0.34 |
0.20 - 5.30 |
0.8807 times |
Fri 28 February 2025 |
0.35 (-36.36%) |
0.50 |
0.31 - 0.71 |
0.4538 times |
Fri 31 January 2025 |
0.55 (-6.78%) |
0.59 |
0.37 - 1.27 |
3.4334 times |
DMA SMA EMA moving averages of Nanovibronix Inc NAOV
DMA (daily moving average) of Nanovibronix Inc NAOV
| DMA period | DMA value | | 5 day DMA | 4.05 | | 12 day DMA | 4.41 | | 20 day DMA | 4.76 | | 35 day DMA | 5.39 | | 50 day DMA | 5.81 | | 100 day DMA | 4.54 | | 150 day DMA | 3.8 | | 200 day DMA | 3.52 | EMA (exponential moving average) of Nanovibronix Inc NAOV
| EMA period | EMA current | EMA prev | EMA prev2 | | 5 day EMA | 4.01 | 4.14 | 4.31 | | 12 day EMA | 4.37 | 4.49 | 4.61 | | 20 day EMA | 4.7 | 4.8 | 4.9 | | 35 day EMA | 5.17 | 5.25 | 5.34 | | 50 day EMA | 5.64 | 5.72 | 5.8 |
SMA (simple moving average) of Nanovibronix Inc NAOV
| SMA period | SMA current | SMA prev | SMA prev2 | | 5 day SMA | 4.05 | 4.19 | 4.36 | | 12 day SMA | 4.41 | 4.5 | 4.58 | | 20 day SMA | 4.76 | 4.87 | 4.97 | | 35 day SMA | 5.39 | 5.45 | 5.53 | | 50 day SMA | 5.81 | 5.87 | 5.92 | | 100 day SMA | 4.54 | 4.51 | 4.48 | | 150 day SMA | 3.8 | 3.83 | 3.85 | | 200 day SMA | 3.52 | 3.51 | 3.49 |
|
|
