MersanaTherapeutics MRSN full analysis,charts,indicators,moving averages,SMA,DMA,EMA,ADX,MACD,RSIMersana Therapeutics MRSN WideScreen charts, DMA,SMA,EMA technical analysis, forecast prediction, by indicators ADX,MACD,RSI,CCI USA stock exchange
operates under Health Care sector & deals in Major Pharmaceuticals
Daily price and charts and targets MersanaTherapeutics Strong Daily Stock price targets for MersanaTherapeutics MRSN are 27.02 and 27.76 | Daily Target 1 | 26.85 | | Daily Target 2 | 27.18 | | Daily Target 3 | 27.59 | | Daily Target 4 | 27.92 | | Daily Target 5 | 28.33 |
Daily price and volume Mersana Therapeutics
| Date |
Closing |
Open |
Range |
Volume |
Thu 20 November 2025 |
27.51 (-0.36%) |
27.89 |
27.26 - 28.00 |
0.3651 times |
Wed 19 November 2025 |
27.61 (0.25%) |
27.61 |
27.42 - 27.95 |
0.2695 times |
Tue 18 November 2025 |
27.54 (-0.65%) |
27.70 |
27.50 - 27.99 |
0.2363 times |
Mon 17 November 2025 |
27.72 (-0.72%) |
27.60 |
27.54 - 28.05 |
0.4728 times |
Fri 14 November 2025 |
27.92 (1.71%) |
27.21 |
27.11 - 28.12 |
1.2679 times |
Thu 13 November 2025 |
27.45 (209.47%) |
9.33 |
9.33 - 29.89 |
7.0224 times |
Wed 12 November 2025 |
8.87 (-0.45%) |
8.70 |
8.45 - 8.88 |
0.0655 times |
Tue 11 November 2025 |
8.91 (3.48%) |
8.61 |
8.35 - 8.91 |
0.0815 times |
Mon 10 November 2025 |
8.61 (2.38%) |
8.50 |
8.26 - 8.71 |
0.1165 times |
Fri 07 November 2025 |
8.41 (4.6%) |
8.00 |
7.54 - 8.43 |
0.1026 times |
Thu 06 November 2025 |
8.04 (-4.96%) |
8.43 |
8.00 - 8.87 |
0.0981 times |
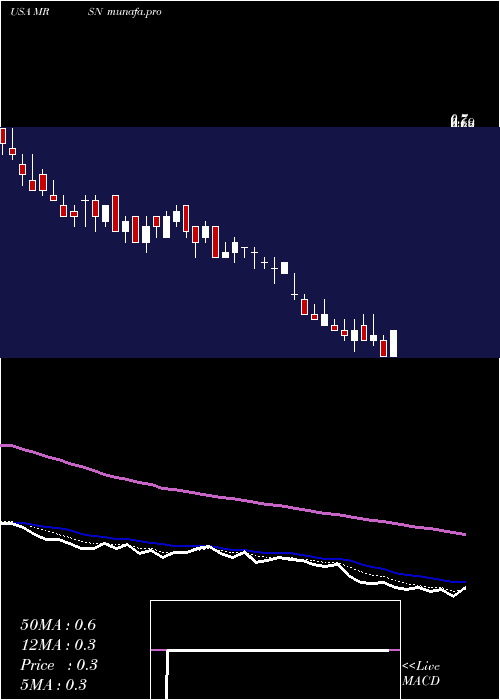
Weekly price and charts MersanaTherapeutics Strong weekly Stock price targets for MersanaTherapeutics MRSN are 26.99 and 27.78 | Weekly Target 1 | 26.82 | | Weekly Target 2 | 27.16 | | Weekly Target 3 | 27.606666666667 | | Weekly Target 4 | 27.95 | | Weekly Target 5 | 28.4 |
Weekly price and volumes for Mersana Therapeutics
| Date |
Closing |
Open |
Range |
Volume |
Thu 20 November 2025 |
27.51 (-1.47%) |
27.60 |
27.26 - 28.05 |
0.8544 times |
Fri 14 November 2025 |
27.92 (231.99%) |
8.50 |
8.26 - 29.89 |
5.4393 times |
Fri 07 November 2025 |
8.41 (-12.21%) |
9.15 |
7.54 - 9.15 |
0.2747 times |
Fri 31 October 2025 |
9.58 (0%) |
9.30 |
9.24 - 9.87 |
0.0672 times |
Fri 31 October 2025 |
9.58 (-2.04%) |
9.90 |
9.24 - 10.64 |
0.3452 times |
Fri 24 October 2025 |
9.78 (-1.01%) |
9.92 |
8.76 - 10.51 |
0.3836 times |
Fri 17 October 2025 |
9.88 (6.93%) |
9.28 |
9.24 - 11.15 |
0.9901 times |
Fri 10 October 2025 |
9.24 (11.59%) |
8.50 |
7.83 - 9.50 |
0.8227 times |
Fri 03 October 2025 |
8.28 (9.38%) |
7.54 |
7.37 - 8.28 |
0.4173 times |
Fri 26 September 2025 |
7.57 (4.41%) |
7.17 |
6.87 - 7.57 |
0.4056 times |
Fri 19 September 2025 |
7.25 (1.54%) |
7.34 |
7.04 - 7.49 |
0.4352 times |
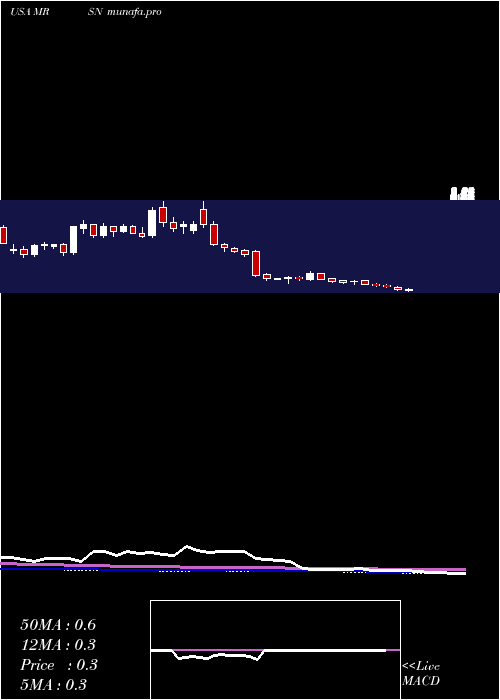
Monthly price and charts MersanaTherapeutics Strong monthly Stock price targets for MersanaTherapeutics MRSN are 17.53 and 39.88 | Monthly Target 1 | -0.7 | | Monthly Target 2 | 13.4 | | Monthly Target 3 | 21.646666666667 | | Monthly Target 4 | 35.75 | | Monthly Target 5 | 44 |
Monthly price and volumes Mersana Therapeutics
| Date |
Closing |
Open |
Range |
Volume |
Thu 20 November 2025 |
27.51 (187.16%) |
9.15 |
7.54 - 29.89 |
0.0901 times |
Fri 31 October 2025 |
9.58 (23.45%) |
7.71 |
7.63 - 11.15 |
0.0391 times |
Tue 30 September 2025 |
7.76 (6.01%) |
7.33 |
6.63 - 8.22 |
0.0263 times |
Fri 29 August 2025 |
7.32 (6.86%) |
6.66 |
5.21 - 8.19 |
0.0539 times |
Thu 31 July 2025 |
6.85 (2183.33%) |
0.30 |
0.27 - 7.60 |
1.4791 times |
Mon 30 June 2025 |
0.30 (-11.76%) |
0.34 |
0.28 - 0.46 |
1.4564 times |
Fri 30 May 2025 |
0.34 (-20.93%) |
0.43 |
0.30 - 0.43 |
1.6454 times |
Wed 30 April 2025 |
0.43 (26.47%) |
0.34 |
0.26 - 0.44 |
1.3275 times |
Mon 31 March 2025 |
0.34 (-34.62%) |
0.53 |
0.34 - 0.55 |
1.4945 times |
Fri 28 February 2025 |
0.52 (-14.75%) |
0.59 |
0.48 - 0.82 |
2.3877 times |
Fri 31 January 2025 |
0.61 (-57.34%) |
1.44 |
0.49 - 1.51 |
5.3152 times |

DMA SMA EMA moving averages of Mersana Therapeutics MRSN
DMA (daily moving average) of Mersana Therapeutics MRSN
| DMA period | DMA value | | 5 day DMA | 27.66 | | 12 day DMA | 18.09 | | 20 day DMA | 14.69 | | 35 day DMA | 12.48 | | 50 day DMA | 10.97 | | 100 day DMA | 7.89 | | 150 day DMA | 5.38 | | 200 day DMA | 4.15 | EMA (exponential moving average) of Mersana Therapeutics MRSN
| EMA period | EMA current | EMA prev | EMA prev2 | | 5 day EMA | 25.93 | 25.14 | 23.91 | | 12 day EMA | 20.75 | 19.52 | 18.05 | | 20 day EMA | 17.41 | 16.35 | 15.16 | | 35 day EMA | 14.19 | 13.41 | 12.57 | | 50 day EMA | 12.32 | 11.7 | 11.05 |
SMA (simple moving average) of Mersana Therapeutics MRSN
| SMA period | SMA current | SMA prev | SMA prev2 | | 5 day SMA | 27.66 | 27.65 | 23.9 | | 12 day SMA | 18.09 | 16.47 | 14.97 | | 20 day SMA | 14.69 | 13.81 | 12.89 | | 35 day SMA | 12.48 | 11.92 | 11.36 | | 50 day SMA | 10.97 | 10.56 | 10.16 | | 100 day SMA | 7.89 | 7.61 | 7.34 | | 150 day SMA | 5.38 | 5.2 | 5.01 | | 200 day SMA | 4.15 | 4.01 | 3.88 |
|
|
