MedicalProperties MPW full analysis,charts,indicators,moving averages,SMA,DMA,EMA,ADX,MACD,RSIMedical Properties MPW WideScreen charts, DMA,SMA,EMA technical analysis, forecast prediction, by indicators ADX,MACD,RSI,CCI USA stock exchange
operates under Consumer Services sector & deals in Real Estate Investment Trusts
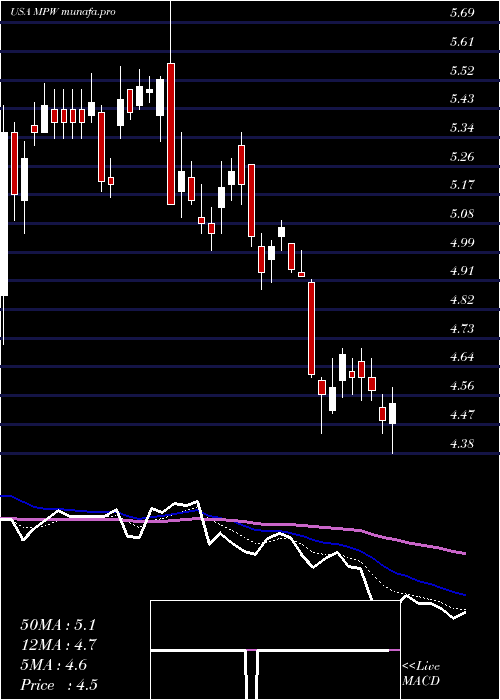
Daily price and charts and targets MedicalProperties Strong Daily Stock price targets for MedicalProperties MPW are 5.02 and 5.16 | Daily Target 1 | 4.99 | | Daily Target 2 | 5.04 | | Daily Target 3 | 5.1266666666667 | | Daily Target 4 | 5.18 | | Daily Target 5 | 5.27 |
Daily price and volume Medical Properties
| Date |
Closing |
Open |
Range |
Volume |
Fri 12 December 2025 |
5.10 (-0.58%) |
5.15 |
5.07 - 5.21 |
1.2735 times |
Thu 11 December 2025 |
5.13 (-6.9%) |
5.43 |
5.03 - 5.43 |
1.6892 times |
Wed 10 December 2025 |
5.51 (1.1%) |
5.46 |
5.45 - 5.58 |
1.4812 times |
Tue 09 December 2025 |
5.45 (-0.55%) |
5.48 |
5.45 - 5.54 |
0.6114 times |
Mon 08 December 2025 |
5.48 (0%) |
5.47 |
5.47 - 5.55 |
0.7765 times |
Fri 05 December 2025 |
5.48 (-2.32%) |
5.61 |
5.47 - 5.64 |
0.776 times |
Thu 04 December 2025 |
5.61 (-0.18%) |
5.62 |
5.60 - 5.69 |
0.6794 times |
Wed 03 December 2025 |
5.62 (0.18%) |
5.61 |
5.58 - 5.65 |
0.9193 times |
Tue 02 December 2025 |
5.61 (-0.18%) |
5.59 |
5.52 - 5.62 |
0.7709 times |
Mon 01 December 2025 |
5.62 (-2.43%) |
5.68 |
5.59 - 5.73 |
1.0226 times |
Fri 28 November 2025 |
5.76 (-0.17%) |
5.79 |
5.74 - 5.80 |
0.5689 times |
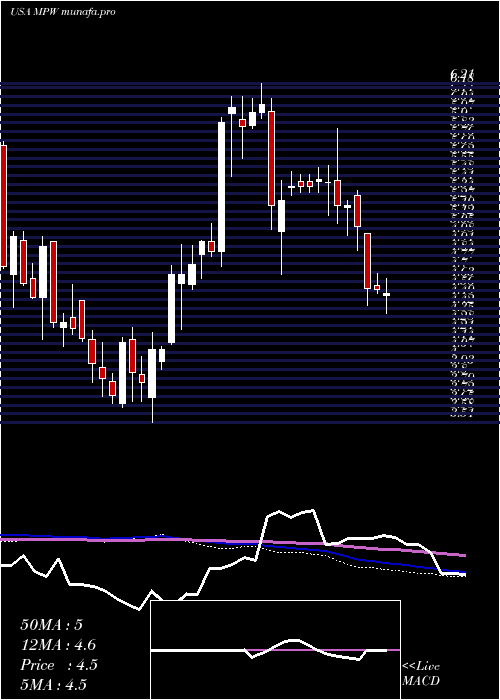
Weekly price and charts MedicalProperties Strong weekly Stock price targets for MedicalProperties MPW are 4.79 and 5.34 | Weekly Target 1 | 4.69 | | Weekly Target 2 | 4.89 | | Weekly Target 3 | 5.2366666666667 | | Weekly Target 4 | 5.44 | | Weekly Target 5 | 5.79 |
Weekly price and volumes for Medical Properties
| Date |
Closing |
Open |
Range |
Volume |
Fri 12 December 2025 |
5.10 (-6.93%) |
5.47 |
5.03 - 5.58 |
1.1949 times |
Fri 05 December 2025 |
5.48 (-4.86%) |
5.68 |
5.47 - 5.73 |
0.854 times |
Fri 28 November 2025 |
5.76 (8.68%) |
5.31 |
5.26 - 5.82 |
0.9752 times |
Fri 21 November 2025 |
5.30 (7.07%) |
5.00 |
4.96 - 5.31 |
1.268 times |
Fri 14 November 2025 |
4.95 (-2.56%) |
5.08 |
4.88 - 5.15 |
1.2675 times |
Fri 07 November 2025 |
5.08 (-1.74%) |
5.04 |
4.80 - 5.10 |
1.0729 times |
Fri 31 October 2025 |
5.17 (0%) |
5.17 |
5.02 - 5.20 |
0.2356 times |
Fri 31 October 2025 |
5.17 (0.58%) |
5.12 |
4.80 - 5.20 |
1.3668 times |
Fri 24 October 2025 |
5.14 (-0.19%) |
5.14 |
4.98 - 5.25 |
0.788 times |
Fri 17 October 2025 |
5.15 (0%) |
5.17 |
5.08 - 5.37 |
0.9772 times |
Fri 10 October 2025 |
5.15 (-7.04%) |
5.56 |
5.08 - 5.59 |
1.1266 times |
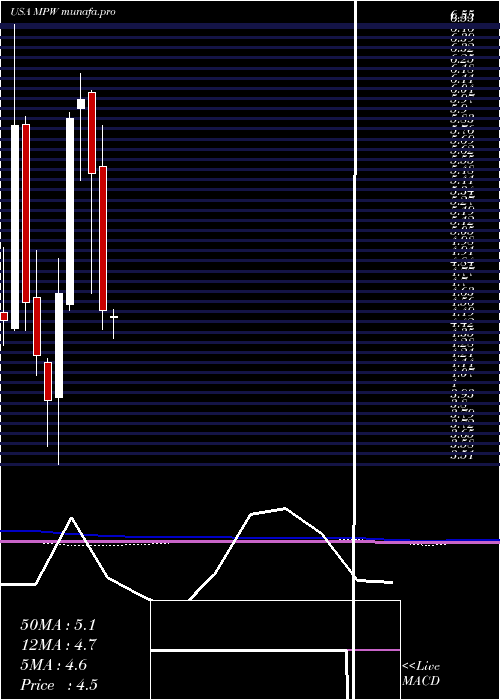
Monthly price and charts MedicalProperties Strong monthly Stock price targets for MedicalProperties MPW are 4.72 and 5.42 | Monthly Target 1 | 4.59 | | Monthly Target 2 | 4.84 | | Monthly Target 3 | 5.2866666666667 | | Monthly Target 4 | 5.54 | | Monthly Target 5 | 5.99 |
Monthly price and volumes Medical Properties
| Date |
Closing |
Open |
Range |
Volume |
Fri 12 December 2025 |
5.10 (-11.46%) |
5.68 |
5.03 - 5.73 |
0.3699 times |
Fri 28 November 2025 |
5.76 (11.41%) |
5.04 |
4.80 - 5.82 |
0.8275 times |
Fri 31 October 2025 |
5.17 (1.97%) |
5.07 |
4.80 - 5.75 |
1 times |
Tue 30 September 2025 |
5.07 (12.67%) |
4.45 |
4.34 - 5.17 |
1.1827 times |
Fri 29 August 2025 |
4.50 (9.22%) |
4.13 |
3.95 - 4.51 |
0.9667 times |
Thu 31 July 2025 |
4.12 (-4.41%) |
4.27 |
3.99 - 4.64 |
1.206 times |
Mon 30 June 2025 |
4.31 (-5.69%) |
4.52 |
4.25 - 4.68 |
0.914 times |
Fri 30 May 2025 |
4.57 (-17.21%) |
5.57 |
4.44 - 5.85 |
1.1211 times |
Wed 30 April 2025 |
5.52 (-8.46%) |
6.08 |
4.69 - 6.09 |
1.1839 times |
Mon 31 March 2025 |
6.03 (2.2%) |
5.97 |
5.47 - 6.21 |
1.2282 times |
Fri 28 February 2025 |
5.90 (25.8%) |
4.61 |
4.57 - 5.94 |
1.2073 times |
DMA SMA EMA moving averages of Medical Properties MPW
DMA (daily moving average) of Medical Properties MPW
| DMA period | DMA value | | 5 day DMA | 5.33 | | 12 day DMA | 5.51 | | 20 day DMA | 5.38 | | 35 day DMA | 5.23 | | 50 day DMA | 5.24 | | 100 day DMA | 4.88 | | 150 day DMA | 4.75 | | 200 day DMA | 4.96 | EMA (exponential moving average) of Medical Properties MPW
| EMA period | EMA current | EMA prev | EMA prev2 | | 5 day EMA | 5.29 | 5.38 | 5.51 | | 12 day EMA | 5.38 | 5.43 | 5.48 | | 20 day EMA | 5.35 | 5.38 | 5.41 | | 35 day EMA | 5.32 | 5.33 | 5.34 | | 50 day EMA | 5.24 | 5.25 | 5.25 |
SMA (simple moving average) of Medical Properties MPW
| SMA period | SMA current | SMA prev | SMA prev2 | | 5 day SMA | 5.33 | 5.41 | 5.51 | | 12 day SMA | 5.51 | 5.56 | 5.57 | | 20 day SMA | 5.38 | 5.38 | 5.37 | | 35 day SMA | 5.23 | 5.23 | 5.23 | | 50 day SMA | 5.24 | 5.25 | 5.25 | | 100 day SMA | 4.88 | 4.87 | 4.86 | | 150 day SMA | 4.75 | 4.75 | 4.75 | | 200 day SMA | 4.96 | 4.96 | 4.96 |
|
|
