LennarCorporation LEN.B full analysis,charts,indicators,moving averages,SMA,DMA,EMA,ADX,MACD,RSILennar Corporation LEN.B WideScreen charts, DMA,SMA,EMA technical analysis, forecast prediction, by indicators ADX,MACD,RSI,CCI USA stock exchange
operates under Basic Industries sector & deals in Homebuilding
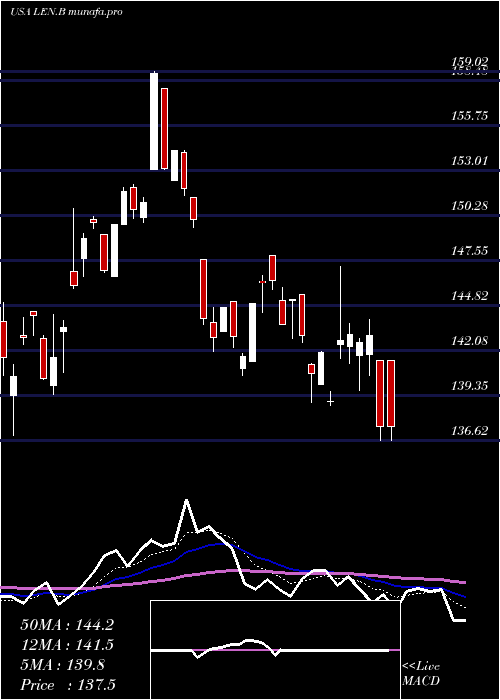
Daily price and charts and targets LennarCorporation Strong Daily Stock price targets for LennarCorporation LEN.B are 153.32 and 155.13 | Daily Target 1 | 151.81 | | Daily Target 2 | 153.01 | | Daily Target 3 | 153.61666666667 | | Daily Target 4 | 154.82 | | Daily Target 5 | 155.43 |
Daily price and volume Lennar Corporation
| Date |
Closing |
Open |
Range |
Volume |
Fri 17 May 2024 |
154.22 (0.72%) |
152.41 |
152.41 - 154.22 |
0.4494 times |
Thu 16 May 2024 |
153.12 (-3.63%) |
158.00 |
153.09 - 158.00 |
1.1492 times |
Wed 15 May 2024 |
158.89 (5.17%) |
153.10 |
153.10 - 159.02 |
2.1415 times |
Tue 14 May 2024 |
151.08 (0.27%) |
150.14 |
149.86 - 151.38 |
0.7935 times |
Mon 13 May 2024 |
150.67 (-0.69%) |
152.00 |
150.12 - 152.20 |
0.901 times |
Fri 10 May 2024 |
151.72 (1.31%) |
149.76 |
149.75 - 151.96 |
0.7384 times |
Thu 09 May 2024 |
149.76 (1.9%) |
146.57 |
146.57 - 149.76 |
0.664 times |
Wed 08 May 2024 |
146.97 (-1.92%) |
149.13 |
146.80 - 149.13 |
1.3611 times |
Tue 07 May 2024 |
149.85 (0.62%) |
150.04 |
149.48 - 150.24 |
1.0112 times |
Mon 06 May 2024 |
148.92 (1.97%) |
147.71 |
146.61 - 149.18 |
0.7908 times |
Fri 03 May 2024 |
146.05 (1.77%) |
146.89 |
145.84 - 150.71 |
1.4272 times |
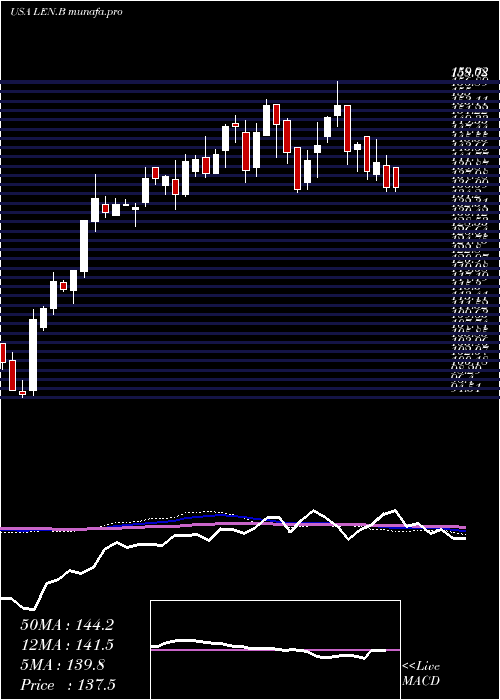
Weekly price and charts LennarCorporation Strong weekly Stock price targets for LennarCorporation LEN.B are 152.04 and 161.2 | Weekly Target 1 | 145.21 | | Weekly Target 2 | 149.71 | | Weekly Target 3 | 154.36666666667 | | Weekly Target 4 | 158.87 | | Weekly Target 5 | 163.53 |
Weekly price and volumes for Lennar Corporation
| Date |
Closing |
Open |
Range |
Volume |
Fri 17 May 2024 |
154.22 (1.65%) |
152.00 |
149.86 - 159.02 |
0.8313 times |
Fri 10 May 2024 |
151.72 (3.88%) |
147.71 |
146.57 - 151.96 |
0.6984 times |
Fri 03 May 2024 |
146.05 (2.22%) |
144.48 |
139.45 - 150.71 |
0.8526 times |
Fri 26 April 2024 |
142.88 (4.25%) |
138.40 |
136.95 - 145.00 |
0.872 times |
Fri 19 April 2024 |
137.06 (-5.12%) |
145.51 |
136.31 - 145.51 |
0.9567 times |
Fri 12 April 2024 |
144.46 (-3.81%) |
151.14 |
142.29 - 151.56 |
1.1262 times |
Fri 05 April 2024 |
150.18 (-2.59%) |
154.32 |
143.51 - 154.32 |
0.8497 times |
Thu 28 March 2024 |
154.18 (3.73%) |
148.10 |
148.10 - 155.30 |
0.9213 times |
Fri 22 March 2024 |
148.63 (5.52%) |
141.53 |
139.74 - 150.54 |
1.0284 times |
Fri 15 March 2024 |
140.86 (-5.98%) |
148.58 |
138.50 - 151.12 |
1.8633 times |
Fri 08 March 2024 |
149.82 (-0.07%) |
150.42 |
146.49 - 152.00 |
0.5542 times |
Monthly price and charts LennarCorporation Strong monthly Stock price targets for LennarCorporation LEN.B are 146.84 and 166.41 | Monthly Target 1 | 131.33 | | Monthly Target 2 | 142.77 | | Monthly Target 3 | 150.89666666667 | | Monthly Target 4 | 162.34 | | Monthly Target 5 | 170.47 |
Monthly price and volumes Lennar Corporation
| Date |
Closing |
Open |
Range |
Volume |
Fri 17 May 2024 |
154.22 (9.85%) |
140.00 |
139.45 - 159.02 |
0.4486 times |
Tue 30 April 2024 |
140.39 (-8.94%) |
154.32 |
136.31 - 154.32 |
0.8884 times |
Thu 28 March 2024 |
154.18 (4.62%) |
146.29 |
138.50 - 155.30 |
0.9768 times |
Thu 29 February 2024 |
147.37 (6.21%) |
140.34 |
139.28 - 147.90 |
0.6907 times |
Wed 31 January 2024 |
138.75 (3.51%) |
132.83 |
129.56 - 142.89 |
0.9367 times |
Fri 29 December 2023 |
134.05 (16.83%) |
114.94 |
114.46 - 140.08 |
1.1714 times |
Thu 30 November 2023 |
114.74 (16.36%) |
98.06 |
98.06 - 120.16 |
0.7798 times |
Tue 31 October 2023 |
98.61 (-3.54%) |
101.14 |
94.51 - 107.27 |
1.0822 times |
Fri 29 September 2023 |
102.23 (-4.15%) |
107.13 |
99.68 - 109.04 |
1.5213 times |
Thu 31 August 2023 |
106.66 (-7.18%) |
113.97 |
101.27 - 116.08 |
1.504 times |
Mon 31 July 2023 |
114.91 (1.71%) |
112.71 |
107.73 - 121.08 |
1.4441 times |

DMA SMA EMA moving averages of Lennar Corporation LEN.B
DMA (daily moving average) of Lennar Corporation LEN.B
| DMA period | DMA value | | 5 day DMA | 153.6 | | 12 day DMA | 150.4 | | 20 day DMA | 146.93 | | 35 day DMA | 145.99 | | 50 day DMA | 146.45 | | 100 day DMA | 143.36 | | 150 day DMA | 134.23 | | 200 day DMA | 126.76 | EMA (exponential moving average) of Lennar Corporation LEN.B
| EMA period | EMA current | EMA prev | EMA prev2 | | 5 day EMA | 153.45 | 153.07 | 153.05 | | 12 day EMA | 150.74 | 150.11 | 149.56 | | 20 day EMA | 148.87 | 148.31 | 147.8 | | 35 day EMA | 147.86 | 147.49 | 147.16 | | 50 day EMA | 147.36 | 147.08 | 146.83 |
SMA (simple moving average) of Lennar Corporation LEN.B
| SMA period | SMA current | SMA prev | SMA prev2 | | 5 day SMA | 153.6 | 153.1 | 152.42 | | 12 day SMA | 150.4 | 149.35 | 148.29 | | 20 day SMA | 146.93 | 146.07 | 145.38 | | 35 day SMA | 145.99 | 145.99 | 145.94 | | 50 day SMA | 146.45 | 146.38 | 146.28 | | 100 day SMA | 143.36 | 143.16 | 142.96 | | 150 day SMA | 134.23 | 133.88 | 133.54 | | 200 day SMA | 126.76 | 126.56 | 126.35 |
|
|
