LakelandBancorp LBAI full analysis,charts,indicators,moving averages,SMA,DMA,EMA,ADX,MACD,RSILakeland Bancorp LBAI WideScreen charts, DMA,SMA,EMA technical analysis, forecast prediction, by indicators ADX,MACD,RSI,CCI USA stock exchange
operates under Finance sector & deals in Major Banks
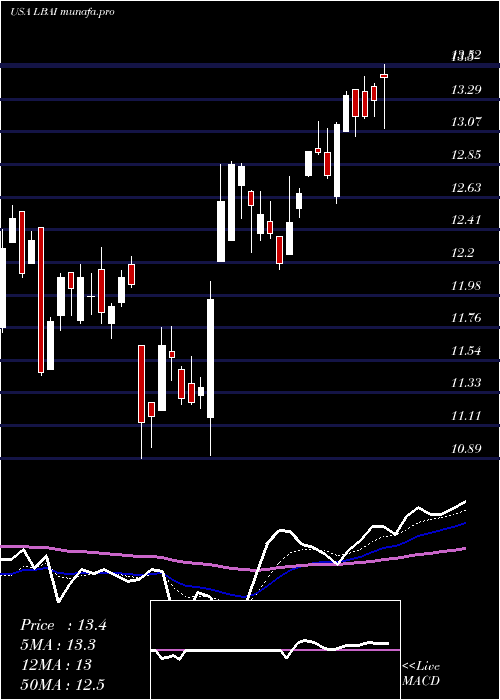
Daily price and charts and targets LakelandBancorp Strong Daily Stock price targets for LakelandBancorp LBAI are 13.05 and 13.48 | Daily Target 1 | 12.92 | | Daily Target 2 | 13.17 | | Daily Target 3 | 13.346666666667 | | Daily Target 4 | 13.6 | | Daily Target 5 | 13.78 |
Daily price and volume Lakeland Bancorp
| Date |
Closing |
Open |
Range |
Volume |
Wed 15 May 2024 |
13.43 (1.13%) |
13.45 |
13.09 - 13.52 |
3.1718 times |
Tue 14 May 2024 |
13.28 (0.84%) |
13.37 |
13.17 - 13.39 |
1.052 times |
Mon 13 May 2024 |
13.17 (0%) |
13.34 |
13.16 - 13.44 |
0.6625 times |
Fri 10 May 2024 |
13.17 (-1.05%) |
13.35 |
13.04 - 13.35 |
0.5297 times |
Thu 09 May 2024 |
13.31 (1.45%) |
13.07 |
13.07 - 13.34 |
0.7117 times |
Wed 08 May 2024 |
13.12 (2.66%) |
12.64 |
12.59 - 13.13 |
0.8273 times |
Tue 07 May 2024 |
12.78 (-1.16%) |
12.93 |
12.76 - 13.09 |
0.79 times |
Mon 06 May 2024 |
12.93 (-0.08%) |
12.96 |
12.92 - 13.14 |
0.5904 times |
Fri 03 May 2024 |
12.94 (2.21%) |
12.78 |
12.77 - 12.94 |
0.954 times |
Thu 02 May 2024 |
12.66 (1.61%) |
12.56 |
12.50 - 12.69 |
0.7105 times |
Wed 01 May 2024 |
12.46 (2.21%) |
12.25 |
12.25 - 12.77 |
1.7842 times |
Weekly price and charts LakelandBancorp Strong weekly Stock price targets for LakelandBancorp LBAI are 13.26 and 13.69 | Weekly Target 1 | 12.92 | | Weekly Target 2 | 13.17 | | Weekly Target 3 | 13.346666666667 | | Weekly Target 4 | 13.6 | | Weekly Target 5 | 13.78 |
Weekly price and volumes for Lakeland Bancorp
| Date |
Closing |
Open |
Range |
Volume |
Wed 15 May 2024 |
13.43 (1.97%) |
13.34 |
13.09 - 13.52 |
0.6352 times |
Fri 10 May 2024 |
13.17 (1.78%) |
12.96 |
12.59 - 13.35 |
0.4483 times |
Fri 03 May 2024 |
12.94 (3.35%) |
12.47 |
12.15 - 12.94 |
0.7631 times |
Fri 26 April 2024 |
12.52 (4.77%) |
12.20 |
12.20 - 12.87 |
1.2852 times |
Fri 19 April 2024 |
11.95 (2.66%) |
11.60 |
10.91 - 12.07 |
0.9209 times |
Fri 12 April 2024 |
11.64 (-2.18%) |
11.93 |
10.89 - 12.24 |
1.3475 times |
Fri 05 April 2024 |
11.90 (-1.65%) |
12.13 |
11.69 - 12.30 |
1.4887 times |
Thu 28 March 2024 |
12.10 (-0.17%) |
12.19 |
11.44 - 12.43 |
0.8731 times |
Fri 22 March 2024 |
12.12 (2.28%) |
11.83 |
11.62 - 12.58 |
1.1499 times |
Fri 15 March 2024 |
11.85 (-4.44%) |
12.40 |
11.33 - 12.47 |
1.0881 times |
Fri 08 March 2024 |
12.40 (6.07%) |
11.69 |
11.49 - 12.66 |
0.6402 times |
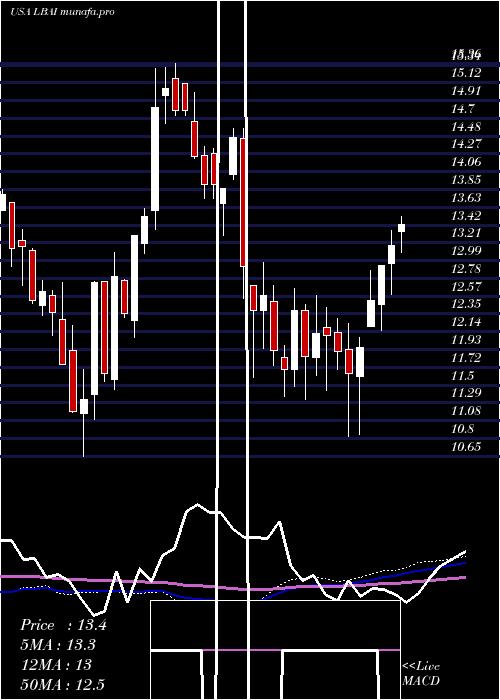
Monthly price and charts LakelandBancorp Strong monthly Stock price targets for LakelandBancorp LBAI are 12.84 and 14.11 | Monthly Target 1 | 11.8 | | Monthly Target 2 | 12.61 | | Monthly Target 3 | 13.066666666667 | | Monthly Target 4 | 13.88 | | Monthly Target 5 | 14.34 |
Monthly price and volumes Lakeland Bancorp
| Date |
Closing |
Open |
Range |
Volume |
Wed 15 May 2024 |
13.43 (10.17%) |
12.25 |
12.25 - 13.52 |
0.5478 times |
Tue 30 April 2024 |
12.19 (0.74%) |
12.13 |
10.89 - 12.87 |
1.9158 times |
Thu 28 March 2024 |
12.10 (3.6%) |
11.65 |
11.33 - 12.66 |
1.3841 times |
Thu 29 February 2024 |
11.68 (-12.11%) |
13.32 |
11.42 - 13.58 |
0.9551 times |
Wed 31 January 2024 |
13.29 (-10.14%) |
14.66 |
13.28 - 15.01 |
0.7007 times |
Fri 29 December 2023 |
14.79 (19.37%) |
12.36 |
12.26 - 15.36 |
0.9594 times |
Thu 30 November 2023 |
12.39 (9.84%) |
11.25 |
11.09 - 13.09 |
0.8112 times |
Tue 31 October 2023 |
11.28 (-10.62%) |
12.58 |
10.65 - 12.73 |
1.1208 times |
Fri 29 September 2023 |
12.62 (-6.59%) |
13.59 |
12.34 - 13.85 |
0.7846 times |
Thu 31 August 2023 |
13.51 (-10.59%) |
15.03 |
13.12 - 15.25 |
0.8206 times |
Mon 31 July 2023 |
15.11 (12.85%) |
13.35 |
12.94 - 16.00 |
0.7311 times |

DMA SMA EMA moving averages of Lakeland Bancorp LBAI
DMA (daily moving average) of Lakeland Bancorp LBAI
| DMA period | DMA value | | 5 day DMA | 13.27 | | 12 day DMA | 12.95 | | 20 day DMA | 12.73 | | 35 day DMA | 12.3 | | 50 day DMA | 12.23 | | 100 day DMA | 12.78 | | 150 day DMA | 12.74 | | 200 day DMA | 12.86 | EMA (exponential moving average) of Lakeland Bancorp LBAI
| EMA period | EMA current | EMA prev | EMA prev2 | | 5 day EMA | 13.25 | 13.16 | 13.1 | | 12 day EMA | 13 | 12.92 | 12.86 | | 20 day EMA | 12.77 | 12.7 | 12.64 | | 35 day EMA | 12.55 | 12.5 | 12.45 | | 50 day EMA | 12.29 | 12.24 | 12.2 |
SMA (simple moving average) of Lakeland Bancorp LBAI
| SMA period | SMA current | SMA prev | SMA prev2 | | 5 day SMA | 13.27 | 13.21 | 13.11 | | 12 day SMA | 12.95 | 12.87 | 12.8 | | 20 day SMA | 12.73 | 12.62 | 12.52 | | 35 day SMA | 12.3 | 12.24 | 12.22 | | 50 day SMA | 12.23 | 12.2 | 12.17 | | 100 day SMA | 12.78 | 12.8 | 12.82 | | 150 day SMA | 12.74 | 12.73 | 12.72 | | 200 day SMA | 12.86 | 12.87 | 12.88 |
|
|
