IntevacInc IVAC full analysis,charts,indicators,moving averages,SMA,DMA,EMA,ADX,MACD,RSIIntevac Inc IVAC WideScreen charts, DMA,SMA,EMA technical analysis, forecast prediction, by indicators ADX,MACD,RSI,CCI USA stock exchange
operates under Technology sector & deals in Industrial Machinery Components
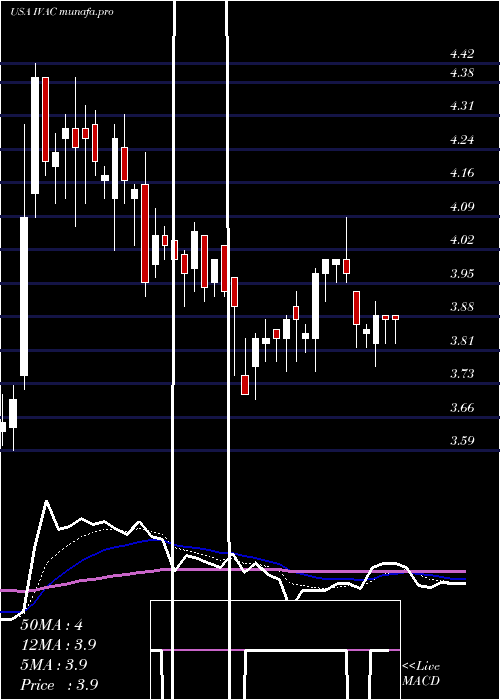
Daily price and charts and targets IntevacInc Strong Daily Stock price targets for IntevacInc IVAC are 3.88 and 4 | Daily Target 1 | 3.84 | | Daily Target 2 | 3.91 | | Daily Target 3 | 3.9633333333333 | | Daily Target 4 | 4.03 | | Daily Target 5 | 4.08 |
Daily price and volume Intevac Inc
| Date |
Closing |
Open |
Range |
Volume |
Fri 17 May 2024 |
3.97 (-0.75%) |
4.01 |
3.90 - 4.02 |
0.7151 times |
Thu 16 May 2024 |
4.00 (-0.74%) |
4.04 |
3.98 - 4.10 |
0.8754 times |
Wed 15 May 2024 |
4.03 (-0.49%) |
4.05 |
4.00 - 4.07 |
0.6403 times |
Tue 14 May 2024 |
4.05 (2.53%) |
3.99 |
3.96 - 4.11 |
0.6076 times |
Mon 13 May 2024 |
3.95 (-4.82%) |
4.16 |
3.92 - 4.23 |
2.1403 times |
Fri 10 May 2024 |
4.15 (-0.48%) |
4.13 |
4.03 - 4.16 |
1.1248 times |
Thu 09 May 2024 |
4.17 (-2.11%) |
4.24 |
4.12 - 4.31 |
1.0667 times |
Wed 08 May 2024 |
4.26 (1.91%) |
4.13 |
4.02 - 4.29 |
0.8005 times |
Tue 07 May 2024 |
4.18 (-0.71%) |
4.17 |
4.13 - 4.20 |
1.3688 times |
Mon 06 May 2024 |
4.21 (-1.17%) |
4.29 |
4.18 - 4.32 |
0.6605 times |
Fri 03 May 2024 |
4.26 (0.47%) |
4.28 |
4.12 - 4.33 |
0.7373 times |
Weekly price and charts IntevacInc Strong weekly Stock price targets for IntevacInc IVAC are 3.77 and 4.1 | Weekly Target 1 | 3.7 | | Weekly Target 2 | 3.84 | | Weekly Target 3 | 4.0333333333333 | | Weekly Target 4 | 4.17 | | Weekly Target 5 | 4.36 |
Weekly price and volumes for Intevac Inc
| Date |
Closing |
Open |
Range |
Volume |
Fri 17 May 2024 |
3.97 (-4.34%) |
4.16 |
3.90 - 4.23 |
0.7323 times |
Fri 10 May 2024 |
4.15 (-2.58%) |
4.29 |
4.02 - 4.32 |
0.7386 times |
Fri 03 May 2024 |
4.26 (-2.96%) |
4.39 |
4.07 - 4.39 |
0.7991 times |
Fri 26 April 2024 |
4.39 (21.61%) |
3.61 |
3.59 - 4.42 |
2.2614 times |
Fri 19 April 2024 |
3.61 (-4.5%) |
3.76 |
3.57 - 3.78 |
0.8169 times |
Fri 12 April 2024 |
3.78 (-0.79%) |
3.85 |
3.70 - 3.95 |
0.9161 times |
Fri 05 April 2024 |
3.81 (-0.78%) |
3.83 |
3.66 - 3.99 |
0.7893 times |
Thu 28 March 2024 |
3.84 (-2.04%) |
3.90 |
3.76 - 3.95 |
0.6409 times |
Fri 22 March 2024 |
3.92 (3.16%) |
3.81 |
3.81 - 4.18 |
1.263 times |
Fri 15 March 2024 |
3.80 (-0.52%) |
3.83 |
3.65 - 3.88 |
1.0426 times |
Fri 08 March 2024 |
3.82 (-2.55%) |
3.91 |
3.68 - 3.97 |
0.8257 times |
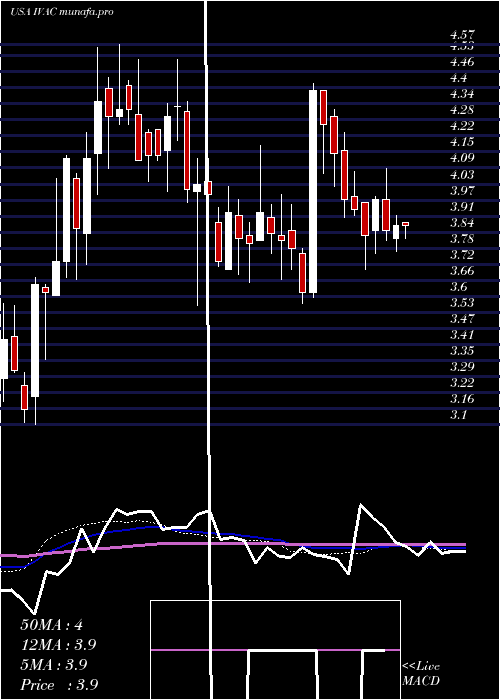
Monthly price and charts IntevacInc Strong monthly Stock price targets for IntevacInc IVAC are 3.69 and 4.18 | Monthly Target 1 | 3.6 | | Monthly Target 2 | 3.78 | | Monthly Target 3 | 4.0866666666667 | | Monthly Target 4 | 4.27 | | Monthly Target 5 | 4.58 |
Monthly price and volumes Intevac Inc
| Date |
Closing |
Open |
Range |
Volume |
Fri 17 May 2024 |
3.97 (-6.15%) |
4.26 |
3.90 - 4.39 |
0.4688 times |
Tue 30 April 2024 |
4.23 (10.16%) |
3.83 |
3.57 - 4.42 |
1.2562 times |
Thu 28 March 2024 |
3.84 (-0.52%) |
3.97 |
3.65 - 4.18 |
0.9694 times |
Thu 29 February 2024 |
3.86 (-6.54%) |
4.08 |
3.56 - 4.15 |
0.8095 times |
Wed 31 January 2024 |
4.13 (-4.4%) |
4.30 |
4.00 - 4.51 |
0.5944 times |
Fri 29 December 2023 |
4.32 (16.13%) |
3.72 |
3.66 - 4.57 |
1.0784 times |
Thu 30 November 2023 |
3.72 (15.89%) |
3.25 |
3.10 - 4.14 |
0.8339 times |
Tue 31 October 2023 |
3.21 (3.22%) |
3.12 |
3.08 - 3.57 |
0.9551 times |
Fri 29 September 2023 |
3.11 (-10.37%) |
3.48 |
3.07 - 3.63 |
1.3443 times |
Thu 31 August 2023 |
3.47 (-3.07%) |
3.50 |
3.35 - 3.92 |
1.6901 times |
Mon 31 July 2023 |
3.58 (-4.53%) |
3.75 |
3.40 - 3.78 |
1.3509 times |

DMA SMA EMA moving averages of Intevac Inc IVAC
DMA (daily moving average) of Intevac Inc IVAC
| DMA period | DMA value | | 5 day DMA | 4 | | 12 day DMA | 4.12 | | 20 day DMA | 4.08 | | 35 day DMA | 3.94 | | 50 day DMA | 3.92 | | 100 day DMA | 4 | | 150 day DMA | 3.93 | | 200 day DMA | 3.78 | EMA (exponential moving average) of Intevac Inc IVAC
| EMA period | EMA current | EMA prev | EMA prev2 | | 5 day EMA | 4.02 | 4.04 | 4.06 | | 12 day EMA | 4.06 | 4.08 | 4.09 | | 20 day EMA | 4.05 | 4.06 | 4.07 | | 35 day EMA | 4.01 | 4.01 | 4.01 | | 50 day EMA | 3.92 | 3.92 | 3.92 |
SMA (simple moving average) of Intevac Inc IVAC
| SMA period | SMA current | SMA prev | SMA prev2 | | 5 day SMA | 4 | 4.04 | 4.07 | | 12 day SMA | 4.12 | 4.15 | 4.17 | | 20 day SMA | 4.08 | 4.07 | 4.05 | | 35 day SMA | 3.94 | 3.94 | 3.94 | | 50 day SMA | 3.92 | 3.92 | 3.92 | | 100 day SMA | 4 | 4 | 4.01 | | 150 day SMA | 3.93 | 3.92 | 3.92 | | 200 day SMA | 3.78 | 3.78 | 3.78 |
|
|
