IsramcoInc ISRL full analysis,charts,indicators,moving averages,SMA,DMA,EMA,ADX,MACD,RSIIsramco Inc ISRL WideScreen charts, DMA,SMA,EMA technical analysis, forecast prediction, by indicators ADX,MACD,RSI,CCI USA stock exchange
operates under Energy sector & deals in Oil Gas Production
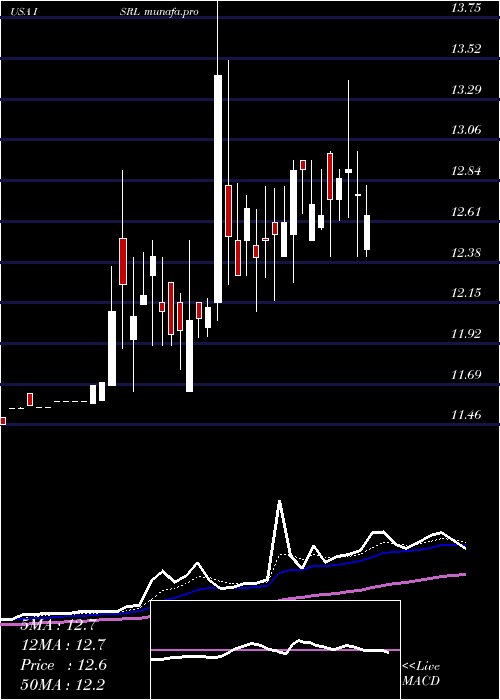
Daily price and charts and targets IsramcoInc Strong Daily Stock price targets for IsramcoInc ISRL are 12.13 and 12.67 | Daily Target 1 | 11.68 | | Daily Target 2 | 12.04 | | Daily Target 3 | 12.22 | | Daily Target 4 | 12.58 | | Daily Target 5 | 12.76 |
Daily price and volume Isramco Inc
| Date |
Closing |
Open |
Range |
Volume |
Wed 03 December 2025 |
12.40 (-0.8%) |
12.00 |
11.86 - 12.40 |
1.3736 times |
Mon 01 December 2025 |
12.50 (0%) |
12.48 |
12.48 - 12.50 |
0.4396 times |
Fri 28 November 2025 |
12.50 (0.08%) |
12.50 |
12.50 - 12.50 |
0.0549 times |
Wed 26 November 2025 |
12.49 (0%) |
12.34 |
12.34 - 12.49 |
0.2747 times |
Tue 25 November 2025 |
12.49 (0.73%) |
12.49 |
12.49 - 12.49 |
0.0549 times |
Mon 24 November 2025 |
12.40 (0%) |
12.35 |
12.33 - 12.40 |
0.3297 times |
Fri 21 November 2025 |
12.40 (0%) |
12.20 |
12.10 - 12.40 |
1.4835 times |
Thu 20 November 2025 |
12.40 (0.24%) |
12.08 |
12.07 - 12.40 |
4.4505 times |
Tue 18 November 2025 |
12.37 (-0.08%) |
12.27 |
12.18 - 12.37 |
0.2198 times |
Fri 14 November 2025 |
12.38 (0.08%) |
12.38 |
12.38 - 12.38 |
1.3187 times |
Thu 13 November 2025 |
12.37 (0%) |
12.35 |
12.35 - 12.35 |
0 times |
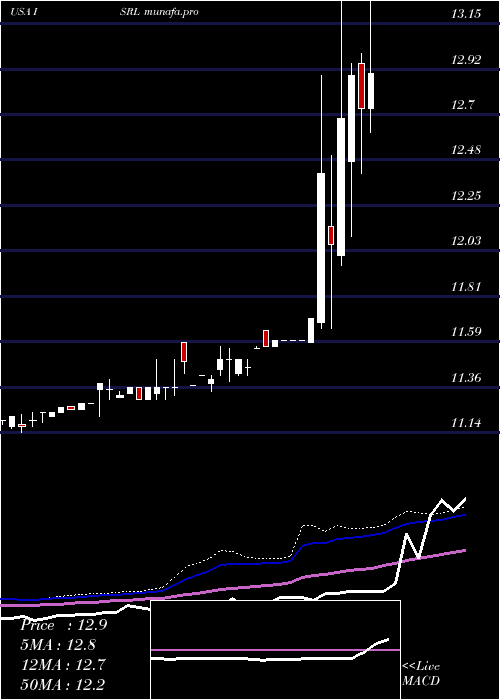
Weekly price and charts IsramcoInc Strong weekly Stock price targets for IsramcoInc ISRL are 11.81 and 12.45 | Weekly Target 1 | 11.61 | | Weekly Target 2 | 12.01 | | Weekly Target 3 | 12.253333333333 | | Weekly Target 4 | 12.65 | | Weekly Target 5 | 12.89 |
Weekly price and volumes for Isramco Inc
| Date |
Closing |
Open |
Range |
Volume |
Wed 03 December 2025 |
12.40 (-0.8%) |
12.48 |
11.86 - 12.50 |
0.1769 times |
Fri 28 November 2025 |
12.50 (0.81%) |
12.35 |
12.33 - 12.50 |
0.0697 times |
Fri 21 November 2025 |
12.40 (0.16%) |
12.27 |
12.07 - 12.40 |
0.6003 times |
Fri 14 November 2025 |
12.38 (-0.16%) |
12.28 |
12.28 - 12.39 |
0.1715 times |
Fri 07 November 2025 |
12.40 (-0.64%) |
12.35 |
12.20 - 12.50 |
0.2894 times |
Thu 30 October 2025 |
12.48 (0.08%) |
12.42 |
12.35 - 12.49 |
0.1233 times |
Tue 21 October 2025 |
12.47 (0.56%) |
12.35 |
12.33 - 12.49 |
0.059 times |
Fri 17 October 2025 |
12.40 (1.14%) |
12.35 |
12.28 - 12.40 |
1.163 times |
Fri 10 October 2025 |
12.26 (-3.46%) |
12.56 |
11.81 - 13.00 |
5.4937 times |
Fri 03 October 2025 |
12.70 (-2.31%) |
12.25 |
12.16 - 12.70 |
1.8533 times |
Thu 25 September 2025 |
13.00 (2.77%) |
12.22 |
12.22 - 13.00 |
0.1769 times |
Monthly price and charts IsramcoInc Strong monthly Stock price targets for IsramcoInc ISRL are 11.81 and 12.45 | Monthly Target 1 | 11.61 | | Monthly Target 2 | 12.01 | | Monthly Target 3 | 12.253333333333 | | Monthly Target 4 | 12.65 | | Monthly Target 5 | 12.89 |
Monthly price and volumes Isramco Inc
| Date |
Closing |
Open |
Range |
Volume |
Wed 03 December 2025 |
12.40 (-0.8%) |
12.48 |
11.86 - 12.50 |
0.0227 times |
Fri 28 November 2025 |
12.50 (0.16%) |
12.35 |
12.07 - 12.50 |
0.1454 times |
Thu 30 October 2025 |
12.48 (-0.79%) |
12.45 |
11.81 - 13.00 |
0.8984 times |
Tue 30 September 2025 |
12.58 (-0.08%) |
12.47 |
11.99 - 13.00 |
0.4954 times |
Fri 29 August 2025 |
12.59 (1.53%) |
12.04 |
11.81 - 13.00 |
0.3494 times |
Thu 31 July 2025 |
12.40 (-2.36%) |
12.54 |
12.03 - 12.98 |
0.5928 times |
Mon 30 June 2025 |
12.70 (-0.24%) |
12.73 |
12.31 - 13.90 |
2.3222 times |
Fri 30 May 2025 |
12.73 (5.47%) |
12.14 |
11.65 - 14.00 |
2.2002 times |
Wed 30 April 2025 |
12.07 (5.32%) |
11.55 |
11.55 - 12.89 |
2.7156 times |
Wed 19 March 2025 |
11.46 (-0.35%) |
11.50 |
11.39 - 11.55 |
0.2579 times |
Fri 28 February 2025 |
11.50 (0.09%) |
11.37 |
11.34 - 11.56 |
0.1985 times |
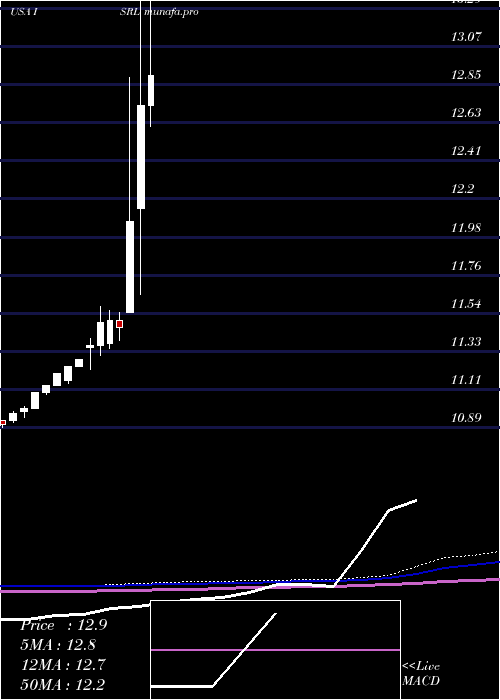
DMA SMA EMA moving averages of Isramco Inc ISRL
DMA (daily moving average) of Isramco Inc ISRL
| DMA period | DMA value | | 5 day DMA | 12.48 | | 12 day DMA | 12.42 | | 20 day DMA | 12.43 | | 35 day DMA | 12.44 | | 50 day DMA | 12.48 | | 100 day DMA | 12.54 | | 150 day DMA | 12.32 | | 200 day DMA | 12.07 | EMA (exponential moving average) of Isramco Inc ISRL
| EMA period | EMA current | EMA prev | EMA prev2 | | 5 day EMA | 12.45 | 12.47 | 12.46 | | 12 day EMA | 12.43 | 12.44 | 12.43 | | 20 day EMA | 12.45 | 12.45 | 12.45 | | 35 day EMA | 12.45 | 12.45 | 12.45 | | 50 day EMA | 12.49 | 12.49 | 12.49 |
SMA (simple moving average) of Isramco Inc ISRL
| SMA period | SMA current | SMA prev | SMA prev2 | | 5 day SMA | 12.48 | 12.48 | 12.46 | | 12 day SMA | 12.42 | 12.42 | 12.41 | | 20 day SMA | 12.43 | 12.43 | 12.43 | | 35 day SMA | 12.44 | 12.45 | 12.44 | | 50 day SMA | 12.48 | 12.48 | 12.49 | | 100 day SMA | 12.54 | 12.55 | 12.55 | | 150 day SMA | 12.32 | 12.31 | 12.31 | | 200 day SMA | 12.07 | 12.06 | 12.06 |
|
|
