InterpublicGroup IPG full analysis,charts,indicators,moving averages,SMA,DMA,EMA,ADX,MACD,RSIInterpublic Group IPG WideScreen charts, DMA,SMA,EMA technical analysis, forecast prediction, by indicators ADX,MACD,RSI,CCI USA stock exchange
operates under Technology sector & deals in Advertising
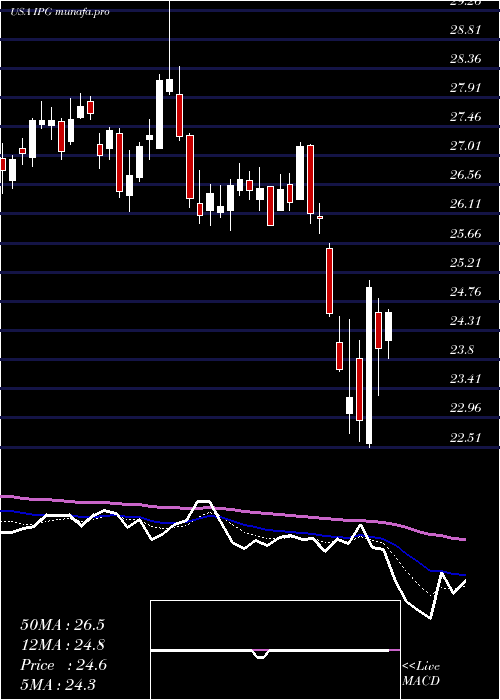
Daily price and charts and targets InterpublicGroup Strong Daily Stock price targets for InterpublicGroup IPG are 24.35 and 25 | Daily Target 1 | 24.24 | | Daily Target 2 | 24.46 | | Daily Target 3 | 24.886666666667 | | Daily Target 4 | 25.11 | | Daily Target 5 | 25.54 |
Daily price and volume Interpublic Group
| Date |
Closing |
Open |
Range |
Volume |
Wed 19 November 2025 |
24.69 (-2.02%) |
25.20 |
24.66 - 25.31 |
1.1955 times |
Tue 18 November 2025 |
25.20 (0.68%) |
24.99 |
24.82 - 25.27 |
1.068 times |
Mon 17 November 2025 |
25.03 (0.97%) |
24.87 |
24.77 - 25.07 |
1.0132 times |
Fri 14 November 2025 |
24.79 (-1.12%) |
25.07 |
24.70 - 25.07 |
0.7381 times |
Thu 13 November 2025 |
25.07 (-1.49%) |
25.38 |
25.04 - 25.53 |
0.7423 times |
Wed 12 November 2025 |
25.45 (0.39%) |
25.31 |
25.18 - 25.57 |
0.6714 times |
Tue 11 November 2025 |
25.35 (1.48%) |
25.24 |
24.87 - 25.41 |
0.6733 times |
Mon 10 November 2025 |
24.98 (-1.89%) |
25.46 |
24.39 - 25.47 |
1.296 times |
Fri 07 November 2025 |
25.46 (1.72%) |
25.09 |
24.97 - 25.51 |
1.4341 times |
Thu 06 November 2025 |
25.03 (-0.67%) |
25.20 |
24.94 - 25.85 |
1.1681 times |
Wed 05 November 2025 |
25.20 (-0.28%) |
25.24 |
25.03 - 25.57 |
0.7145 times |
Weekly price and charts InterpublicGroup Strong weekly Stock price targets for InterpublicGroup IPG are 24.35 and 25 | Weekly Target 1 | 24.24 | | Weekly Target 2 | 24.46 | | Weekly Target 3 | 24.886666666667 | | Weekly Target 4 | 25.11 | | Weekly Target 5 | 25.54 |
Weekly price and volumes for Interpublic Group
| Date |
Closing |
Open |
Range |
Volume |
Wed 19 November 2025 |
24.69 (-0.4%) |
24.87 |
24.66 - 25.31 |
0.6971 times |
Fri 14 November 2025 |
24.79 (-2.63%) |
25.46 |
24.39 - 25.57 |
0.8767 times |
Fri 07 November 2025 |
25.46 (-0.78%) |
25.03 |
24.94 - 25.85 |
0.9151 times |
Fri 31 October 2025 |
25.66 (0%) |
25.45 |
25.37 - 25.77 |
0.2814 times |
Fri 31 October 2025 |
25.66 (-5.17%) |
27.08 |
25.31 - 27.33 |
1.3733 times |
Fri 24 October 2025 |
27.06 (2.54%) |
26.57 |
26.41 - 28.24 |
1.3095 times |
Fri 17 October 2025 |
26.39 (-3.12%) |
26.25 |
25.76 - 27.26 |
1.2964 times |
Tue 07 October 2025 |
27.24 (2.79%) |
26.50 |
26.49 - 27.46 |
0.5054 times |
Fri 03 October 2025 |
26.50 (0.57%) |
26.42 |
25.90 - 28.42 |
1.6973 times |
Fri 26 September 2025 |
26.35 (2.73%) |
25.70 |
25.47 - 26.52 |
1.0476 times |
Fri 19 September 2025 |
25.65 (-2.8%) |
26.50 |
25.35 - 26.86 |
1.3025 times |

Monthly price and charts InterpublicGroup Strong monthly Stock price targets for InterpublicGroup IPG are 23.81 and 25.27 | Monthly Target 1 | 23.52 | | Monthly Target 2 | 24.1 | | Monthly Target 3 | 24.976666666667 | | Monthly Target 4 | 25.56 | | Monthly Target 5 | 26.44 |
Monthly price and volumes Interpublic Group
| Date |
Closing |
Open |
Range |
Volume |
Wed 19 November 2025 |
24.69 (-3.78%) |
25.03 |
24.39 - 25.85 |
0.4814 times |
Fri 31 October 2025 |
25.66 (-8.06%) |
27.92 |
25.31 - 28.24 |
1.0783 times |
Tue 30 September 2025 |
27.91 (3.99%) |
26.35 |
25.35 - 28.42 |
0.9401 times |
Fri 29 August 2025 |
26.84 (9.11%) |
24.57 |
24.11 - 27.41 |
0.8238 times |
Thu 31 July 2025 |
24.60 (0.49%) |
24.28 |
24.00 - 27.03 |
1.2424 times |
Mon 30 June 2025 |
24.48 (2.17%) |
23.19 |
22.55 - 24.74 |
1.3414 times |
Fri 30 May 2025 |
23.96 (-4.62%) |
25.12 |
23.63 - 26.20 |
0.9609 times |
Wed 30 April 2025 |
25.12 (-7.51%) |
27.17 |
22.51 - 27.19 |
0.7975 times |
Mon 31 March 2025 |
27.16 (-0.88%) |
27.35 |
25.85 - 29.62 |
1.4624 times |
Fri 28 February 2025 |
27.40 (-4.43%) |
28.43 |
26.43 - 29.25 |
0.8717 times |
Fri 31 January 2025 |
28.67 (2.32%) |
28.10 |
26.30 - 29.52 |
0.7387 times |
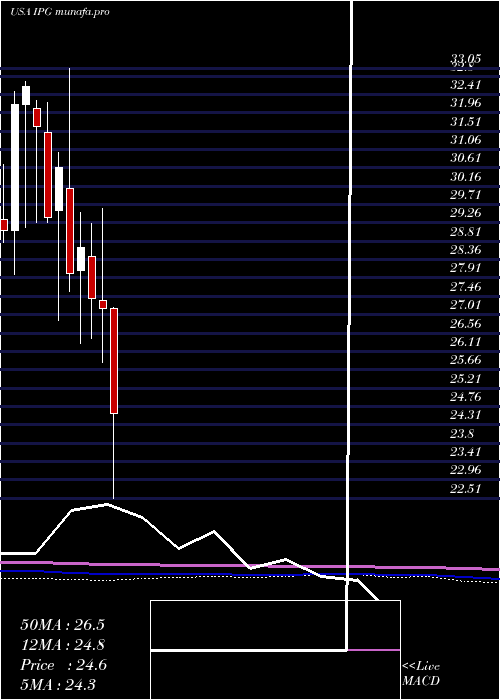
DMA SMA EMA moving averages of Interpublic Group IPG
DMA (daily moving average) of Interpublic Group IPG
| DMA period | DMA value | | 5 day DMA | 24.96 | | 12 day DMA | 25.13 | | 20 day DMA | 25.62 | | 35 day DMA | 26.13 | | 50 day DMA | 26.16 | | 100 day DMA | 25.86 | | 150 day DMA | 25.32 | | 200 day DMA | 25.66 | EMA (exponential moving average) of Interpublic Group IPG
| EMA period | EMA current | EMA prev | EMA prev2 | | 5 day EMA | 24.98 | 25.12 | 25.08 | | 12 day EMA | 25.22 | 25.32 | 25.34 | | 20 day EMA | 25.5 | 25.59 | 25.63 | | 35 day EMA | 25.77 | 25.83 | 25.87 | | 50 day EMA | 26.08 | 26.14 | 26.18 |
SMA (simple moving average) of Interpublic Group IPG
| SMA period | SMA current | SMA prev | SMA prev2 | | 5 day SMA | 24.96 | 25.11 | 25.14 | | 12 day SMA | 25.13 | 25.21 | 25.25 | | 20 day SMA | 25.62 | 25.77 | 25.86 | | 35 day SMA | 26.13 | 26.18 | 26.2 | | 50 day SMA | 26.16 | 26.21 | 26.24 | | 100 day SMA | 25.86 | 25.86 | 25.85 | | 150 day SMA | 25.32 | 25.32 | 25.32 | | 200 day SMA | 25.66 | 25.68 | 25.7 |
|
|
