GuarantyBancshares GNTY full analysis,charts,indicators,moving averages,SMA,DMA,EMA,ADX,MACD,RSIGuaranty Bancshares GNTY WideScreen charts, DMA,SMA,EMA technical analysis, forecast prediction, by indicators ADX,MACD,RSI,CCI USA stock exchange
operates under Finance sector & deals in Major Banks
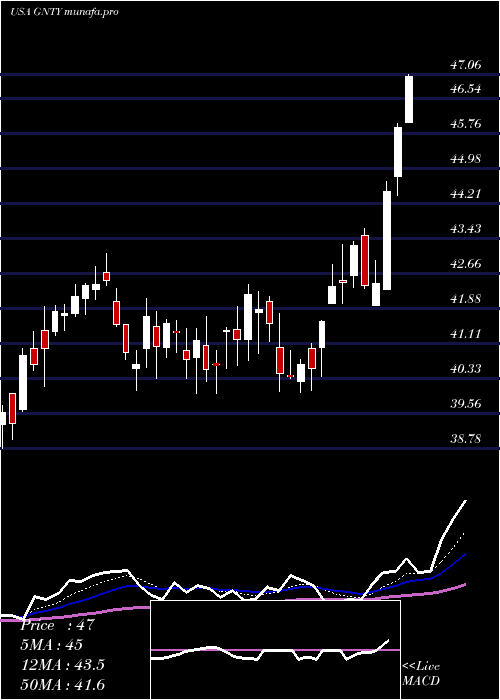
Daily price and charts and targets GuarantyBancshares Strong Daily Stock price targets for GuarantyBancshares GNTY are 49.03 and 49.49 | Daily Target 1 | 48.68 | | Daily Target 2 | 48.91 | | Daily Target 3 | 49.14 | | Daily Target 4 | 49.37 | | Daily Target 5 | 49.6 |
Daily price and volume Guaranty Bancshares
| Date |
Closing |
Open |
Range |
Volume |
Fri 29 August 2025 |
49.14 (0.86%) |
48.98 |
48.91 - 49.37 |
1.155 times |
Thu 28 August 2025 |
48.72 (0.23%) |
48.98 |
48.37 - 48.98 |
0.5557 times |
Wed 27 August 2025 |
48.61 (-0.02%) |
48.29 |
48.29 - 49.02 |
0.9897 times |
Tue 26 August 2025 |
48.62 (0.91%) |
48.04 |
48.04 - 48.94 |
0.7463 times |
Mon 25 August 2025 |
48.18 (-0.66%) |
48.26 |
47.92 - 48.42 |
0.8175 times |
Fri 22 August 2025 |
48.50 (6.69%) |
45.95 |
45.88 - 48.60 |
1.3456 times |
Thu 21 August 2025 |
45.46 (-1.41%) |
45.70 |
45.22 - 45.86 |
0.946 times |
Wed 20 August 2025 |
46.11 (-0.26%) |
46.19 |
45.98 - 46.51 |
1.2078 times |
Tue 19 August 2025 |
46.23 (-0.02%) |
46.38 |
46.01 - 46.82 |
0.8014 times |
Mon 18 August 2025 |
46.24 (1.63%) |
45.37 |
45.25 - 46.28 |
1.4351 times |
Fri 15 August 2025 |
45.50 (-1.47%) |
46.36 |
45.27 - 46.43 |
1.0907 times |
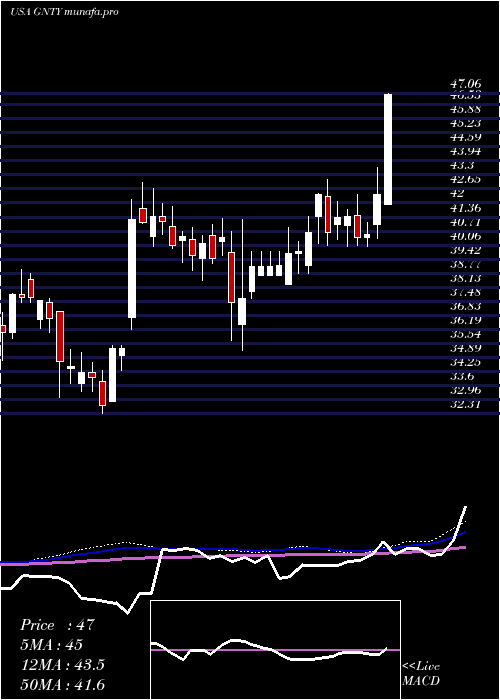
Weekly price and charts GuarantyBancshares Strong weekly Stock price targets for GuarantyBancshares GNTY are 48.53 and 49.98 | Weekly Target 1 | 47.36 | | Weekly Target 2 | 48.25 | | Weekly Target 3 | 48.81 | | Weekly Target 4 | 49.7 | | Weekly Target 5 | 50.26 |
Weekly price and volumes for Guaranty Bancshares
| Date |
Closing |
Open |
Range |
Volume |
Fri 29 August 2025 |
49.14 (1.32%) |
48.26 |
47.92 - 49.37 |
0.6373 times |
Fri 22 August 2025 |
48.50 (6.59%) |
45.37 |
45.22 - 48.60 |
0.8573 times |
Fri 15 August 2025 |
45.50 (4.1%) |
43.75 |
43.36 - 46.83 |
0.7509 times |
Fri 08 August 2025 |
43.71 (2.53%) |
43.45 |
42.96 - 44.20 |
0.5629 times |
Fri 01 August 2025 |
42.63 (-5.69%) |
45.50 |
41.95 - 46.55 |
0.7739 times |
Fri 25 July 2025 |
45.20 (-0.7%) |
45.88 |
44.02 - 46.03 |
0.8676 times |
Fri 18 July 2025 |
45.52 (-0.85%) |
45.67 |
43.81 - 46.92 |
1.0092 times |
Fri 11 July 2025 |
45.91 (-2.34%) |
46.82 |
45.33 - 47.20 |
0.8941 times |
Thu 03 July 2025 |
47.01 (10.87%) |
41.95 |
41.95 - 47.06 |
1.3121 times |
Fri 27 June 2025 |
42.40 (4.56%) |
41.02 |
40.38 - 43.64 |
2.3345 times |
Fri 20 June 2025 |
40.55 (0.3%) |
40.40 |
40.02 - 41.11 |
0.3607 times |
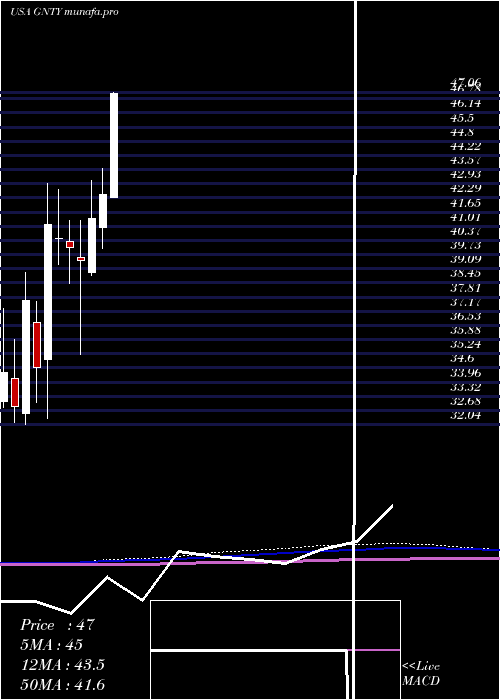
Monthly price and charts GuarantyBancshares Strong monthly Stock price targets for GuarantyBancshares GNTY are 45.55 and 52.97 | Monthly Target 1 | 39.4 | | Monthly Target 2 | 44.27 | | Monthly Target 3 | 46.82 | | Monthly Target 4 | 51.69 | | Monthly Target 5 | 54.24 |
Monthly price and volumes Guaranty Bancshares
| Date |
Closing |
Open |
Range |
Volume |
Fri 29 August 2025 |
49.14 (12.68%) |
43.07 |
41.95 - 49.37 |
1.0641 times |
Thu 31 July 2025 |
43.61 (2.76%) |
42.29 |
42.29 - 47.20 |
1.506 times |
Mon 30 June 2025 |
42.44 (2.66%) |
40.95 |
40.00 - 43.64 |
1.484 times |
Fri 30 May 2025 |
41.34 (4.76%) |
38.90 |
38.78 - 43.09 |
0.6574 times |
Wed 30 April 2025 |
39.46 (-1.42%) |
39.60 |
35.22 - 41.25 |
0.758 times |
Mon 31 March 2025 |
40.03 (-1.04%) |
40.31 |
38.42 - 41.28 |
0.7345 times |
Fri 28 February 2025 |
40.45 (-1.61%) |
40.45 |
39.27 - 42.65 |
0.6288 times |
Fri 31 January 2025 |
41.11 (18.82%) |
34.99 |
32.31 - 42.95 |
1.7151 times |
Tue 31 December 2024 |
34.60 (-8.1%) |
36.65 |
33.03 - 37.60 |
0.9639 times |
Tue 26 November 2024 |
37.65 (14.58%) |
32.52 |
32.04 - 38.93 |
0.4882 times |
Thu 31 October 2024 |
32.86 (-4.42%) |
34.12 |
32.11 - 35.87 |
0.3257 times |
DMA SMA EMA moving averages of Guaranty Bancshares GNTY
DMA (daily moving average) of Guaranty Bancshares GNTY
| DMA period | DMA value | | 5 day DMA | 48.65 | | 12 day DMA | 47.29 | | 20 day DMA | 46.05 | | 35 day DMA | 45.73 | | 50 day DMA | 45.14 | | 100 day DMA | 42.73 | | 150 day DMA | 41.96 | | 200 day DMA | 40.4 | EMA (exponential moving average) of Guaranty Bancshares GNTY
| EMA period | EMA current | EMA prev | EMA prev2 | | 5 day EMA | 48.53 | 48.23 | 47.98 | | 12 day EMA | 47.52 | 47.22 | 46.95 | | 20 day EMA | 46.76 | 46.51 | 46.28 | | 35 day EMA | 45.84 | 45.65 | 45.47 | | 50 day EMA | 45.17 | 45.01 | 44.86 |
SMA (simple moving average) of Guaranty Bancshares GNTY
| SMA period | SMA current | SMA prev | SMA prev2 | | 5 day SMA | 48.65 | 48.53 | 47.87 | | 12 day SMA | 47.29 | 47.09 | 46.84 | | 20 day SMA | 46.05 | 45.78 | 45.57 | | 35 day SMA | 45.73 | 45.66 | 45.57 | | 50 day SMA | 45.14 | 44.97 | 44.8 | | 100 day SMA | 42.73 | 42.62 | 42.5 | | 150 day SMA | 41.96 | 41.91 | 41.84 | | 200 day SMA | 40.4 | 40.31 | 40.24 |
|
|
