GmsInc GMS full analysis,charts,indicators,moving averages,SMA,DMA,EMA,ADX,MACD,RSIGms Inc GMS WideScreen charts, DMA,SMA,EMA technical analysis, forecast prediction, by indicators ADX,MACD,RSI,CCI USA stock exchange
operates under Consumer Services sector & deals in RETAIL Building Materials
Daily price and charts and targets GmsInc Strong Daily Stock price targets for GmsInc GMS are 109.41 and 109.95 | Daily Target 1 | 108.98 | | Daily Target 2 | 109.29 | | Daily Target 3 | 109.51666666667 | | Daily Target 4 | 109.83 | | Daily Target 5 | 110.06 |
Daily price and volume Gms Inc
| Date |
Closing |
Open |
Range |
Volume |
Fri 01 August 2025 |
109.61 (-0.03%) |
109.53 |
109.20 - 109.74 |
1.0553 times |
Thu 31 July 2025 |
109.64 (-0.07%) |
109.70 |
109.41 - 109.83 |
1.318 times |
Wed 30 July 2025 |
109.72 (0.11%) |
109.61 |
109.61 - 109.84 |
0.817 times |
Tue 29 July 2025 |
109.60 (0%) |
109.75 |
109.53 - 109.78 |
0.8409 times |
Mon 28 July 2025 |
109.60 (-0.09%) |
109.60 |
109.53 - 109.73 |
0.7763 times |
Fri 25 July 2025 |
109.70 (0.14%) |
109.64 |
109.52 - 109.80 |
0.7182 times |
Thu 24 July 2025 |
109.55 (0.04%) |
109.45 |
109.45 - 109.65 |
1.3187 times |
Wed 23 July 2025 |
109.51 (-0.14%) |
109.66 |
109.47 - 109.80 |
1.2187 times |
Tue 22 July 2025 |
109.66 (0%) |
109.75 |
109.58 - 109.93 |
0.9717 times |
Mon 21 July 2025 |
109.66 (-0.15%) |
109.90 |
109.66 - 110.11 |
0.9651 times |
Fri 18 July 2025 |
109.83 (-0.12%) |
110.08 |
109.65 - 110.10 |
0.7998 times |
Weekly price and charts GmsInc Strong weekly Stock price targets for GmsInc GMS are 109.41 and 110.05 | Weekly Target 1 | 108.91 | | Weekly Target 2 | 109.26 | | Weekly Target 3 | 109.55 | | Weekly Target 4 | 109.9 | | Weekly Target 5 | 110.19 |
Weekly price and volumes for Gms Inc
| Date |
Closing |
Open |
Range |
Volume |
Fri 01 August 2025 |
109.61 (-0.08%) |
109.60 |
109.20 - 109.84 |
0.9083 times |
Fri 25 July 2025 |
109.70 (-0.12%) |
109.90 |
109.45 - 110.11 |
0.981 times |
Fri 18 July 2025 |
109.83 (0.41%) |
109.40 |
109.40 - 110.28 |
1.3798 times |
Fri 11 July 2025 |
109.38 (-0.29%) |
109.40 |
109.19 - 109.67 |
1.1831 times |
Thu 03 July 2025 |
109.70 (12.71%) |
108.10 |
108.10 - 109.70 |
2.9501 times |
Fri 27 June 2025 |
97.33 (-2.93%) |
99.26 |
97.33 - 101.71 |
0.7406 times |
Fri 20 June 2025 |
100.27 (31.88%) |
75.14 |
73.06 - 105.14 |
1.215 times |
Fri 13 June 2025 |
76.03 (-2.59%) |
79.05 |
75.52 - 80.41 |
0.254 times |
Fri 06 June 2025 |
78.05 (3.06%) |
75.35 |
73.42 - 79.27 |
0.1901 times |
Fri 30 May 2025 |
75.73 (2.87%) |
74.77 |
73.97 - 76.95 |
0.1979 times |
Fri 23 May 2025 |
73.62 (-4.55%) |
75.30 |
72.38 - 76.28 |
0.1869 times |
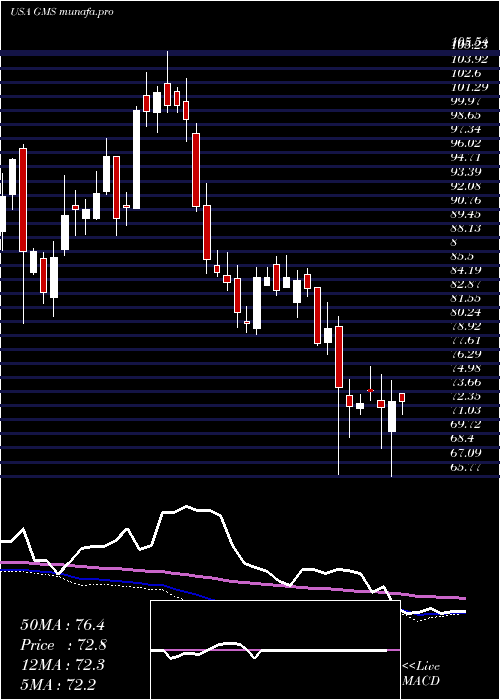
Monthly price and charts GmsInc Strong monthly Stock price targets for GmsInc GMS are 109.41 and 109.95 | Monthly Target 1 | 108.98 | | Monthly Target 2 | 109.29 | | Monthly Target 3 | 109.51666666667 | | Monthly Target 4 | 109.83 | | Monthly Target 5 | 110.06 |
Monthly price and volumes Gms Inc
| Date |
Closing |
Open |
Range |
Volume |
Fri 01 August 2025 |
109.61 (-0.03%) |
109.53 |
109.20 - 109.74 |
0.1144 times |
Thu 31 July 2025 |
109.64 (0.82%) |
108.76 |
108.68 - 110.28 |
3.4866 times |
Mon 30 June 2025 |
108.75 (43.6%) |
75.35 |
73.06 - 109.04 |
2.0217 times |
Fri 30 May 2025 |
75.73 (3.37%) |
73.77 |
71.64 - 79.36 |
0.5158 times |
Wed 30 April 2025 |
73.26 (0.12%) |
73.07 |
65.77 - 75.31 |
0.5554 times |
Mon 31 March 2025 |
73.17 (-8.09%) |
79.76 |
65.88 - 80.73 |
0.9371 times |
Fri 28 February 2025 |
79.61 (-5.61%) |
82.06 |
77.14 - 85.24 |
0.5099 times |
Fri 31 January 2025 |
84.34 (-0.58%) |
85.69 |
78.99 - 86.68 |
0.6308 times |
Tue 31 December 2024 |
84.83 (-15.58%) |
100.80 |
83.22 - 102.97 |
0.665 times |
Tue 26 November 2024 |
100.48 (11.78%) |
90.61 |
90.15 - 105.54 |
0.5634 times |
Thu 31 October 2024 |
89.89 (-0.75%) |
90.25 |
88.29 - 97.42 |
0.4877 times |

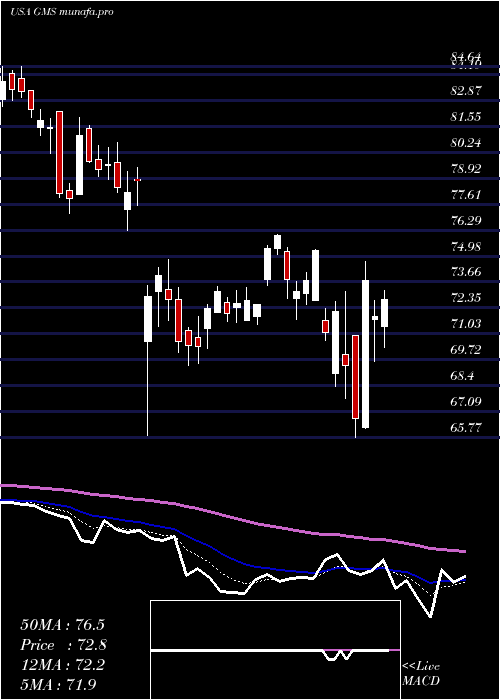
DMA SMA EMA moving averages of Gms Inc GMS
DMA (daily moving average) of Gms Inc GMS
| DMA period | DMA value | | 5 day DMA | 109.63 | | 12 day DMA | 109.67 | | 20 day DMA | 109.66 | | 35 day DMA | 103.15 | | 50 day DMA | 95.07 | | 100 day DMA | 83.96 | | 150 day DMA | 83.33 | | 200 day DMA | 86.18 | EMA (exponential moving average) of Gms Inc GMS
| EMA period | EMA current | EMA prev | EMA prev2 | | 5 day EMA | 109.64 | 109.65 | 109.65 | | 12 day EMA | 109.31 | 109.25 | 109.18 | | 20 day EMA | 107.56 | 107.34 | 107.1 | | 35 day EMA | 101.52 | 101.04 | 100.53 | | 50 day EMA | 94.98 | 94.38 | 93.76 |
SMA (simple moving average) of Gms Inc GMS
| SMA period | SMA current | SMA prev | SMA prev2 | | 5 day SMA | 109.63 | 109.65 | 109.63 | | 12 day SMA | 109.67 | 109.71 | 109.74 | | 20 day SMA | 109.66 | 109.66 | 109.63 | | 35 day SMA | 103.15 | 102.29 | 101.42 | | 50 day SMA | 95.07 | 94.39 | 93.74 | | 100 day SMA | 83.96 | 83.59 | 83.23 | | 150 day SMA | 83.33 | 83.18 | 83.03 | | 200 day SMA | 86.18 | 86.09 | 86.01 |
|
|
