GlenBurnie GLBZ full analysis,charts,indicators,moving averages,SMA,DMA,EMA,ADX,MACD,RSIGlen Burnie GLBZ WideScreen charts, DMA,SMA,EMA technical analysis, forecast prediction, by indicators ADX,MACD,RSI,CCI USA stock exchange
operates under Finance sector & deals in Major Banks
Daily price and charts and targets GlenBurnie Strong Daily Stock price targets for GlenBurnie GLBZ are 4.45 and 4.45 | Daily Target 1 | 4.45 | | Daily Target 2 | 4.45 | | Daily Target 3 | 4.45 | | Daily Target 4 | 4.45 | | Daily Target 5 | 4.45 |
Daily price and volume Glen Burnie
| Date |
Closing |
Open |
Range |
Volume |
Wed 19 November 2025 |
4.45 (-0.89%) |
4.45 |
4.45 - 4.45 |
0.1767 times |
Tue 18 November 2025 |
4.49 (0.45%) |
4.48 |
4.48 - 4.49 |
0.2356 times |
Fri 14 November 2025 |
4.47 (-6.29%) |
4.79 |
4.47 - 4.79 |
1.9588 times |
Thu 13 November 2025 |
4.77 (5.76%) |
4.51 |
4.39 - 4.79 |
3.5346 times |
Wed 12 November 2025 |
4.51 (-1.31%) |
4.51 |
4.51 - 4.51 |
0.1178 times |
Tue 11 November 2025 |
4.57 (0.44%) |
4.53 |
4.51 - 4.57 |
0.5596 times |
Mon 10 November 2025 |
4.55 (0%) |
4.55 |
4.55 - 4.60 |
1.0898 times |
Fri 07 November 2025 |
4.55 (0.66%) |
4.52 |
4.51 - 4.60 |
1.8409 times |
Thu 06 November 2025 |
4.52 (0.22%) |
4.52 |
4.52 - 4.52 |
0.3976 times |
Wed 05 November 2025 |
4.51 (-3.84%) |
4.51 |
4.51 - 4.51 |
0.0884 times |
Tue 04 November 2025 |
4.69 (0.43%) |
4.69 |
4.69 - 4.69 |
0.0442 times |
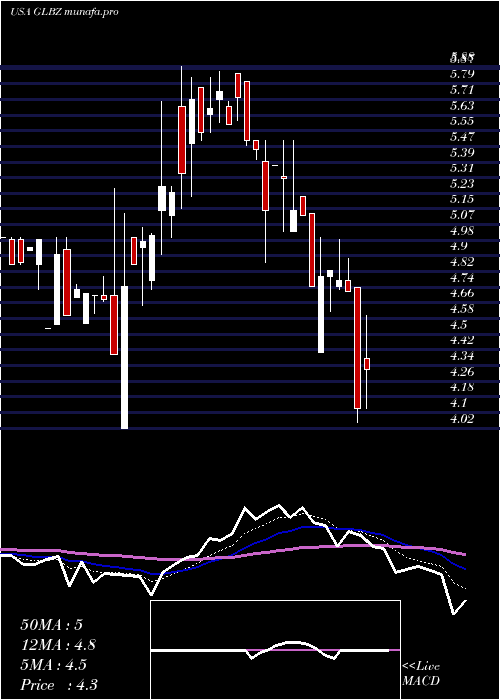
Weekly price and charts GlenBurnie Strong weekly Stock price targets for GlenBurnie GLBZ are 4.43 and 4.47 | Weekly Target 1 | 4.42 | | Weekly Target 2 | 4.44 | | Weekly Target 3 | 4.4633333333333 | | Weekly Target 4 | 4.48 | | Weekly Target 5 | 4.5 |
Weekly price and volumes for Glen Burnie
| Date |
Closing |
Open |
Range |
Volume |
Wed 19 November 2025 |
4.45 (-0.45%) |
4.48 |
4.45 - 4.49 |
0.109 times |
Fri 14 November 2025 |
4.47 (-1.76%) |
4.55 |
4.39 - 4.79 |
1.92 times |
Fri 07 November 2025 |
4.55 (-2.57%) |
4.69 |
4.51 - 4.69 |
0.627 times |
Fri 31 October 2025 |
4.67 (0%) |
4.36 |
4.36 - 4.85 |
0.2687 times |
Fri 31 October 2025 |
4.67 (-3.11%) |
4.53 |
4.36 - 4.85 |
1.9395 times |
Fri 24 October 2025 |
4.82 (1.47%) |
4.78 |
4.71 - 4.89 |
1.3865 times |
Fri 17 October 2025 |
4.75 (1.06%) |
4.71 |
4.30 - 4.84 |
0.7361 times |
Fri 10 October 2025 |
4.70 (-0.21%) |
4.75 |
4.60 - 4.75 |
1.8499 times |
Fri 03 October 2025 |
4.71 (4.67%) |
4.45 |
4.40 - 4.74 |
0.6218 times |
Fri 26 September 2025 |
4.50 (-2.6%) |
4.63 |
4.30 - 4.69 |
0.5413 times |
Fri 19 September 2025 |
4.62 (3.82%) |
4.60 |
4.31 - 4.69 |
0.7867 times |

Monthly price and charts GlenBurnie Strong monthly Stock price targets for GlenBurnie GLBZ are 4.22 and 4.62 | Monthly Target 1 | 4.14 | | Monthly Target 2 | 4.3 | | Monthly Target 3 | 4.5433333333333 | | Monthly Target 4 | 4.7 | | Monthly Target 5 | 4.94 |
Monthly price and volumes Glen Burnie
| Date |
Closing |
Open |
Range |
Volume |
Wed 19 November 2025 |
4.45 (-4.71%) |
4.69 |
4.39 - 4.79 |
0.5242 times |
Fri 31 October 2025 |
4.67 (0.43%) |
4.60 |
4.30 - 4.89 |
1.2333 times |
Tue 30 September 2025 |
4.65 (12.32%) |
4.20 |
4.12 - 4.74 |
0.6118 times |
Fri 29 August 2025 |
4.14 (0.49%) |
4.38 |
3.89 - 4.60 |
1.3642 times |
Thu 31 July 2025 |
4.12 (-17.76%) |
5.14 |
4.05 - 5.88 |
1.7738 times |
Mon 30 June 2025 |
5.01 (1.21%) |
5.00 |
4.02 - 5.25 |
1.6547 times |
Fri 30 May 2025 |
4.95 (-5.71%) |
5.45 |
4.06 - 5.45 |
0.5749 times |
Wed 30 April 2025 |
5.25 (3.55%) |
5.09 |
4.70 - 5.69 |
1.0113 times |
Mon 31 March 2025 |
5.07 (3.47%) |
4.90 |
4.90 - 5.40 |
0.7446 times |
Fri 28 February 2025 |
4.90 (-1.41%) |
4.90 |
4.55 - 5.18 |
0.5072 times |
Fri 31 January 2025 |
4.97 (-14.6%) |
5.85 |
4.10 - 6.25 |
1.4353 times |

DMA SMA EMA moving averages of Glen Burnie GLBZ
DMA (daily moving average) of Glen Burnie GLBZ
| DMA period | DMA value | | 5 day DMA | 4.54 | | 12 day DMA | 4.56 | | 20 day DMA | 4.6 | | 35 day DMA | 4.64 | | 50 day DMA | 4.61 | | 100 day DMA | 4.63 | | 150 day DMA | 4.75 | | 200 day DMA | 4.83 | EMA (exponential moving average) of Glen Burnie GLBZ
| EMA period | EMA current | EMA prev | EMA prev2 | | 5 day EMA | 4.51 | 4.54 | 4.57 | | 12 day EMA | 4.55 | 4.57 | 4.59 | | 20 day EMA | 4.59 | 4.6 | 4.61 | | 35 day EMA | 4.57 | 4.58 | 4.59 | | 50 day EMA | 4.58 | 4.59 | 4.59 |
SMA (simple moving average) of Glen Burnie GLBZ
| SMA period | SMA current | SMA prev | SMA prev2 | | 5 day SMA | 4.54 | 4.56 | 4.57 | | 12 day SMA | 4.56 | 4.58 | 4.59 | | 20 day SMA | 4.6 | 4.62 | 4.63 | | 35 day SMA | 4.64 | 4.64 | 4.64 | | 50 day SMA | 4.61 | 4.61 | 4.61 | | 100 day SMA | 4.63 | 4.63 | 4.63 | | 150 day SMA | 4.75 | 4.75 | 4.76 | | 200 day SMA | 4.83 | 4.84 | 4.84 |
|
|
