GulfIsland GIFI full analysis,charts,indicators,moving averages,SMA,DMA,EMA,ADX,MACD,RSIGulf Island GIFI WideScreen charts, DMA,SMA,EMA technical analysis, forecast prediction, by indicators ADX,MACD,RSI,CCI USA stock exchange
operates under Capital Goods sector & deals in Metal Fabrications
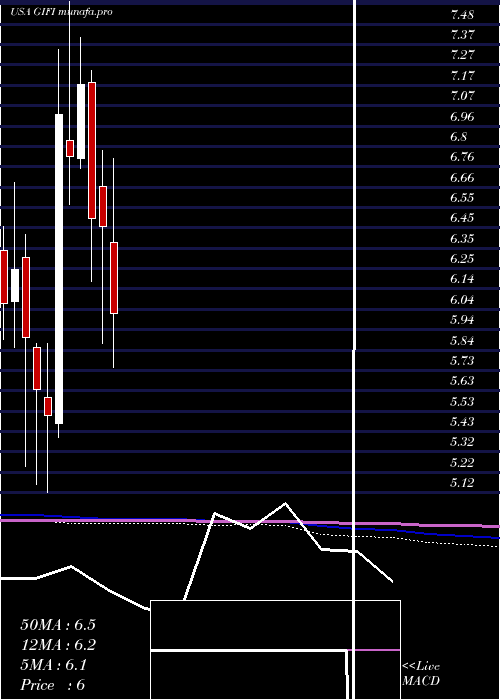
Daily price and charts and targets GulfIsland Strong Daily Stock price targets for GulfIsland GIFI are 11.77 and 11.79 | Daily Target 1 | 11.75 | | Daily Target 2 | 11.77 | | Daily Target 3 | 11.773333333333 | | Daily Target 4 | 11.79 | | Daily Target 5 | 11.79 |
Daily price and volume Gulf Island
| Date |
Closing |
Open |
Range |
Volume |
Wed 19 November 2025 |
11.78 (0.17%) |
11.76 |
11.76 - 11.78 |
0.5699 times |
Tue 18 November 2025 |
11.76 (-0.17%) |
11.76 |
11.76 - 11.78 |
0.5437 times |
Mon 17 November 2025 |
11.78 (0.08%) |
11.76 |
11.76 - 11.78 |
0.4961 times |
Fri 14 November 2025 |
11.77 (0%) |
11.76 |
11.76 - 11.78 |
0.4208 times |
Thu 13 November 2025 |
11.77 (-0.08%) |
11.77 |
11.76 - 11.78 |
0.91 times |
Wed 12 November 2025 |
11.78 (-0.08%) |
11.77 |
11.77 - 11.78 |
1.274 times |
Tue 11 November 2025 |
11.79 (0.17%) |
11.77 |
11.77 - 11.79 |
0.5327 times |
Mon 10 November 2025 |
11.77 (-0.08%) |
11.77 |
11.76 - 11.78 |
2.4422 times |
Fri 07 November 2025 |
11.78 (49.68%) |
11.90 |
11.65 - 11.90 |
2.701 times |
Thu 06 November 2025 |
7.87 (-1.5%) |
7.91 |
7.87 - 8.06 |
0.1096 times |
Wed 05 November 2025 |
7.99 (0.38%) |
8.04 |
7.87 - 8.11 |
0.1514 times |
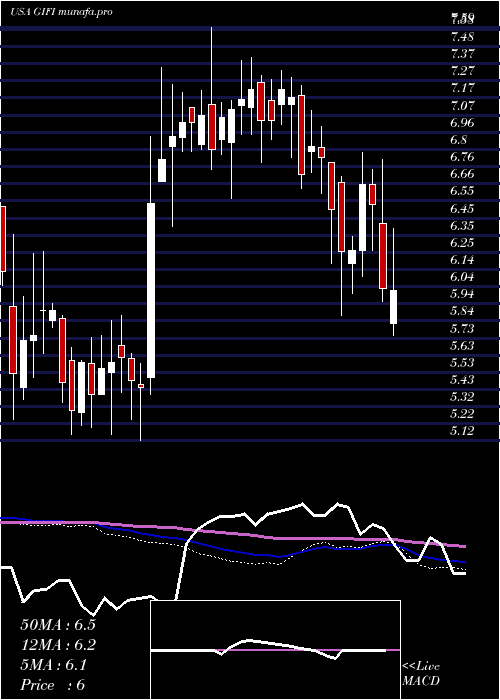
Weekly price and charts GulfIsland Strong weekly Stock price targets for GulfIsland GIFI are 11.77 and 11.79 | Weekly Target 1 | 11.75 | | Weekly Target 2 | 11.77 | | Weekly Target 3 | 11.773333333333 | | Weekly Target 4 | 11.79 | | Weekly Target 5 | 11.79 |
Weekly price and volumes for Gulf Island
| Date |
Closing |
Open |
Range |
Volume |
Wed 19 November 2025 |
11.78 (0.08%) |
11.76 |
11.76 - 11.78 |
1.1681 times |
Fri 14 November 2025 |
11.77 (-0.08%) |
11.77 |
11.76 - 11.79 |
4.0489 times |
Fri 07 November 2025 |
11.78 (50.83%) |
8.01 |
7.75 - 11.90 |
2.199 times |
Fri 31 October 2025 |
7.81 (0%) |
8.00 |
7.78 - 8.01 |
0.0291 times |
Fri 31 October 2025 |
7.81 (-2.38%) |
8.13 |
7.70 - 8.23 |
0.2666 times |
Fri 24 October 2025 |
8.00 (7.96%) |
7.49 |
7.33 - 8.23 |
0.4579 times |
Fri 17 October 2025 |
7.41 (1.93%) |
7.28 |
7.14 - 7.64 |
0.5689 times |
Fri 10 October 2025 |
7.27 (-2.55%) |
7.49 |
7.25 - 7.77 |
0.411 times |
Fri 03 October 2025 |
7.46 (1.5%) |
7.26 |
7.02 - 7.88 |
0.5358 times |
Fri 26 September 2025 |
7.35 (6.37%) |
6.86 |
6.85 - 7.43 |
0.3148 times |
Fri 19 September 2025 |
6.91 (-9.44%) |
7.59 |
6.91 - 7.59 |
0.4998 times |
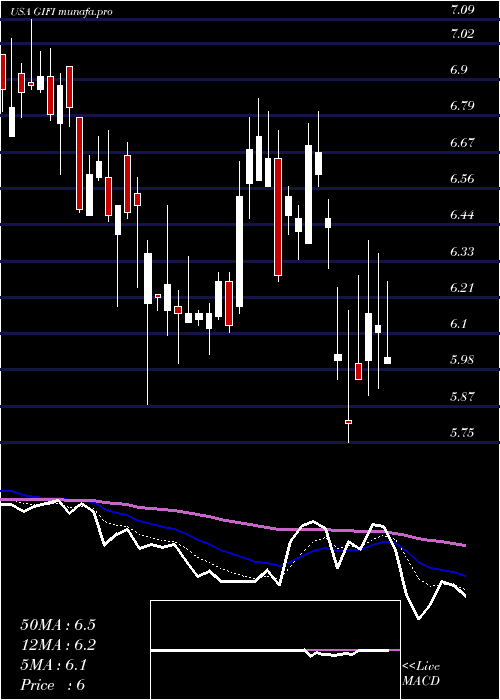
Monthly price and charts GulfIsland Strong monthly Stock price targets for GulfIsland GIFI are 9.77 and 13.92 | Monthly Target 1 | 6.33 | | Monthly Target 2 | 9.05 | | Monthly Target 3 | 10.476666666667 | | Monthly Target 4 | 13.2 | | Monthly Target 5 | 14.63 |
Monthly price and volumes Gulf Island
| Date |
Closing |
Open |
Range |
Volume |
Wed 19 November 2025 |
11.78 (50.83%) |
8.01 |
7.75 - 11.90 |
3.0578 times |
Fri 31 October 2025 |
7.81 (11.25%) |
7.04 |
7.04 - 8.23 |
0.9146 times |
Tue 30 September 2025 |
7.02 (3.85%) |
6.72 |
6.67 - 7.78 |
0.6836 times |
Fri 29 August 2025 |
6.76 (0.6%) |
6.70 |
6.50 - 7.08 |
0.5564 times |
Thu 31 July 2025 |
6.72 (1.05%) |
6.60 |
6.59 - 7.30 |
0.5898 times |
Mon 30 June 2025 |
6.65 (3.58%) |
6.53 |
6.34 - 7.03 |
0.5496 times |
Fri 30 May 2025 |
6.42 (-10.21%) |
7.16 |
6.05 - 7.40 |
1.3177 times |
Wed 30 April 2025 |
7.15 (10.68%) |
6.38 |
5.75 - 7.53 |
0.7812 times |
Mon 31 March 2025 |
6.46 (-0.62%) |
6.66 |
5.87 - 6.84 |
0.9625 times |
Fri 28 February 2025 |
6.50 (-9.34%) |
7.18 |
6.18 - 7.24 |
0.5868 times |
Fri 31 January 2025 |
7.17 (5.29%) |
6.80 |
6.75 - 7.41 |
1.1327 times |
DMA SMA EMA moving averages of Gulf Island GIFI
DMA (daily moving average) of Gulf Island GIFI
| DMA period | DMA value | | 5 day DMA | 11.77 | | 12 day DMA | 10.82 | | 20 day DMA | 9.63 | | 35 day DMA | 8.67 | | 50 day DMA | 8.23 | | 100 day DMA | 7.58 | | 150 day DMA | 7.25 | | 200 day DMA | 7.07 | EMA (exponential moving average) of Gulf Island GIFI
| EMA period | EMA current | EMA prev | EMA prev2 | | 5 day EMA | 11.67 | 11.62 | 11.55 | | 12 day EMA | 10.89 | 10.73 | 10.54 | | 20 day EMA | 10.12 | 9.94 | 9.75 | | 35 day EMA | 9.28 | 9.13 | 8.97 | | 50 day EMA | 8.51 | 8.38 | 8.24 |
SMA (simple moving average) of Gulf Island GIFI
| SMA period | SMA current | SMA prev | SMA prev2 | | 5 day SMA | 11.77 | 11.77 | 11.78 | | 12 day SMA | 10.82 | 10.49 | 10.16 | | 20 day SMA | 9.63 | 9.41 | 9.19 | | 35 day SMA | 8.67 | 8.54 | 8.4 | | 50 day SMA | 8.23 | 8.14 | 8.05 | | 100 day SMA | 7.58 | 7.53 | 7.48 | | 150 day SMA | 7.25 | 7.22 | 7.18 | | 200 day SMA | 7.07 | 7.04 | 7.02 |
|
|
