TegnaInc GCI full analysis,charts,indicators,moving averages,SMA,DMA,EMA,ADX,MACD,RSITegna Inc GCI WideScreen charts, DMA,SMA,EMA technical analysis, forecast prediction, by indicators ADX,MACD,RSI,CCI USA stock exchange
operates under Consumer Services sector & deals in Newspapers Magazines
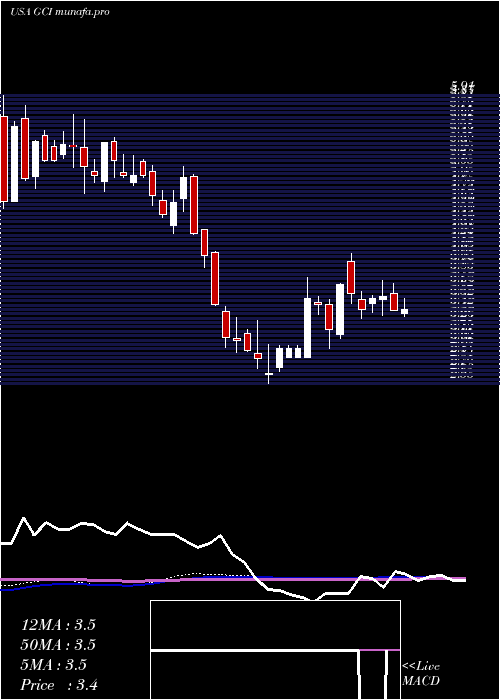
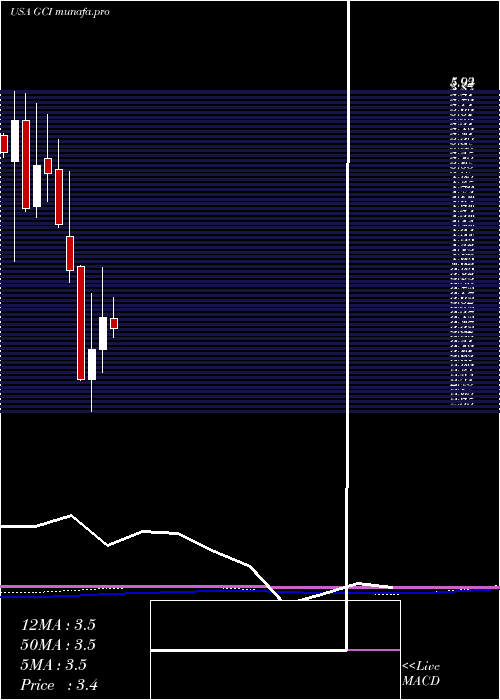
Daily price and charts and targets TegnaInc Strong Daily Stock price targets for TegnaInc GCI are 3.6 and 3.74 | Daily Target 1 | 3.49 | | Daily Target 2 | 3.57 | | Daily Target 3 | 3.6266666666667 | | Daily Target 4 | 3.71 | | Daily Target 5 | 3.77 |
Daily price and volume Tegna Inc
| Date |
Closing |
Open |
Range |
Volume |
Tue 21 October 2025 |
3.66 (3.1%) |
3.55 |
3.54 - 3.68 |
0.4368 times |
Mon 20 October 2025 |
3.55 (-0.28%) |
3.60 |
3.52 - 3.61 |
0.8442 times |
Fri 17 October 2025 |
3.56 (-1.93%) |
3.60 |
3.52 - 3.64 |
0.8318 times |
Thu 16 October 2025 |
3.63 (-2.16%) |
3.71 |
3.58 - 3.80 |
1.1043 times |
Wed 15 October 2025 |
3.71 (3.34%) |
3.61 |
3.61 - 3.83 |
1.4586 times |
Tue 14 October 2025 |
3.59 (2.87%) |
3.43 |
3.42 - 3.61 |
1.1514 times |
Mon 13 October 2025 |
3.49 (-0.57%) |
3.57 |
3.45 - 3.57 |
0.6887 times |
Fri 10 October 2025 |
3.51 (-5.14%) |
3.68 |
3.50 - 3.77 |
0.7417 times |
Thu 09 October 2025 |
3.70 (-4.39%) |
3.85 |
3.64 - 3.89 |
1.7653 times |
Wed 08 October 2025 |
3.87 (-0.77%) |
3.95 |
3.85 - 3.98 |
0.9771 times |
Tue 07 October 2025 |
3.90 (-4.88%) |
4.08 |
3.89 - 4.13 |
1.3234 times |

Weekly price and charts TegnaInc Strong weekly Stock price targets for TegnaInc GCI are 3.59 and 3.75 | Weekly Target 1 | 3.46 | | Weekly Target 2 | 3.56 | | Weekly Target 3 | 3.62 | | Weekly Target 4 | 3.72 | | Weekly Target 5 | 3.78 |
Weekly price and volumes for Tegna Inc
| Date |
Closing |
Open |
Range |
Volume |
Tue 21 October 2025 |
3.66 (2.81%) |
3.60 |
3.52 - 3.68 |
0.3639 times |
Fri 17 October 2025 |
3.56 (1.42%) |
3.57 |
3.42 - 3.83 |
1.487 times |
Fri 10 October 2025 |
3.51 (-15.63%) |
4.18 |
3.50 - 4.20 |
1.59 times |
Fri 03 October 2025 |
4.16 (-1.89%) |
4.26 |
4.06 - 4.27 |
0.9737 times |
Fri 26 September 2025 |
4.24 (-1.4%) |
4.23 |
4.16 - 4.43 |
0.8469 times |
Fri 19 September 2025 |
4.30 (1.65%) |
4.25 |
4.20 - 4.45 |
1.4191 times |
Fri 12 September 2025 |
4.23 (-1.4%) |
4.31 |
4.02 - 4.32 |
0.7359 times |
Fri 05 September 2025 |
4.29 (4.38%) |
4.05 |
4.00 - 4.30 |
0.9202 times |
Fri 29 August 2025 |
4.11 (0%) |
4.10 |
4.06 - 4.13 |
0.243 times |
Fri 29 August 2025 |
4.11 (-3.29%) |
4.21 |
3.97 - 4.22 |
1.4203 times |
Fri 22 August 2025 |
4.25 (0.47%) |
4.24 |
3.94 - 4.30 |
1.8648 times |
Monthly price and charts TegnaInc Strong monthly Stock price targets for TegnaInc GCI are 3.12 and 3.97 | Monthly Target 1 | 2.93 | | Monthly Target 2 | 3.3 | | Monthly Target 3 | 3.7833333333333 | | Monthly Target 4 | 4.15 | | Monthly Target 5 | 4.63 |
Monthly price and volumes Tegna Inc
| Date |
Closing |
Open |
Range |
Volume |
Tue 21 October 2025 |
3.66 (-11.38%) |
4.09 |
3.42 - 4.27 |
0.68 times |
Tue 30 September 2025 |
4.13 (0.49%) |
4.05 |
4.00 - 4.45 |
0.7578 times |
Fri 29 August 2025 |
4.11 (7.87%) |
3.73 |
3.66 - 4.34 |
1.1908 times |
Thu 31 July 2025 |
3.81 (6.42%) |
3.54 |
3.51 - 4.17 |
1.2655 times |
Mon 30 June 2025 |
3.58 (1.13%) |
3.53 |
3.15 - 3.75 |
1.1137 times |
Fri 30 May 2025 |
3.54 (10.63%) |
3.20 |
2.96 - 4.07 |
1.1143 times |
Wed 30 April 2025 |
3.20 (10.73%) |
2.89 |
2.55 - 3.79 |
1.4251 times |
Mon 31 March 2025 |
2.89 (-28.47%) |
4.08 |
2.87 - 4.09 |
0.9927 times |
Fri 28 February 2025 |
4.04 (-10.62%) |
4.40 |
3.91 - 5.08 |
0.7575 times |
Fri 31 January 2025 |
4.52 (-10.67%) |
5.11 |
4.49 - 5.42 |
0.7028 times |
Tue 31 December 2024 |
5.06 (-1.75%) |
5.22 |
4.77 - 5.69 |
0.6116 times |
DMA SMA EMA moving averages of Tegna Inc GCI
DMA (daily moving average) of Tegna Inc GCI
| DMA period | DMA value | | 5 day DMA | 3.62 | | 12 day DMA | 3.69 | | 20 day DMA | 3.9 | | 35 day DMA | 4.05 | | 50 day DMA | 4.08 | | 100 day DMA | 3.87 | | 150 day DMA | 3.65 | | 200 day DMA | 3.84 | EMA (exponential moving average) of Tegna Inc GCI
| EMA period | EMA current | EMA prev | EMA prev2 | | 5 day EMA | 3.62 | 3.6 | 3.63 | | 12 day EMA | 3.71 | 3.72 | 3.75 | | 20 day EMA | 3.83 | 3.85 | 3.88 | | 35 day EMA | 3.93 | 3.95 | 3.97 | | 50 day EMA | 4.02 | 4.03 | 4.05 |
SMA (simple moving average) of Tegna Inc GCI
| SMA period | SMA current | SMA prev | SMA prev2 | | 5 day SMA | 3.62 | 3.61 | 3.6 | | 12 day SMA | 3.69 | 3.73 | 3.78 | | 20 day SMA | 3.9 | 3.93 | 3.96 | | 35 day SMA | 4.05 | 4.06 | 4.07 | | 50 day SMA | 4.08 | 4.08 | 4.09 | | 100 day SMA | 3.87 | 3.87 | 3.87 | | 150 day SMA | 3.65 | 3.65 | 3.65 | | 200 day SMA | 3.84 | 3.85 | 3.86 |
|
|
