GladstoneInvestment GAINL full analysis,charts,indicators,moving averages,SMA,DMA,EMA,ADX,MACD,RSIGladstone Investment GAINL WideScreen charts, DMA,SMA,EMA technical analysis, forecast prediction, by indicators ADX,MACD,RSI,CCI USA stock exchange
operates under N A sector & deals in N A
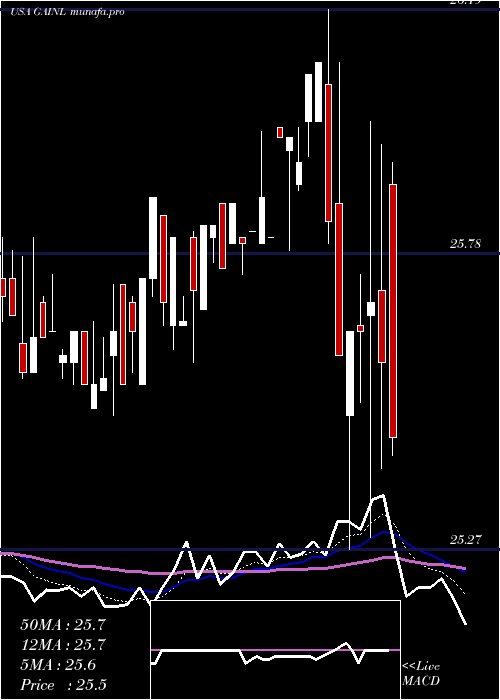
Daily price and charts and targets GladstoneInvestment Strong Daily Stock price targets for GladstoneInvestment GAINL are 25.12 and 25.16 | Daily Target 1 | 25.11 | | Daily Target 2 | 25.13 | | Daily Target 3 | 25.153333333333 | | Daily Target 4 | 25.17 | | Daily Target 5 | 25.19 |
Daily price and volume Gladstone Investment
| Date |
Closing |
Open |
Range |
Volume |
Fri 21 November 2025 |
25.14 (0%) |
25.17 |
25.14 - 25.18 |
0.5607 times |
Thu 20 November 2025 |
25.14 (-0.04%) |
25.17 |
25.14 - 25.17 |
0.9346 times |
Wed 19 November 2025 |
25.15 (0%) |
25.14 |
25.14 - 25.15 |
0.4206 times |
Tue 18 November 2025 |
25.15 (0.2%) |
25.10 |
25.10 - 25.18 |
0.7664 times |
Mon 17 November 2025 |
25.10 (-0.2%) |
25.14 |
25.10 - 25.14 |
2.1869 times |
Fri 14 November 2025 |
25.15 (-2.14%) |
25.43 |
25.11 - 25.45 |
4.2336 times |
Thu 13 November 2025 |
25.70 (-0.31%) |
25.55 |
25.55 - 25.99 |
0.215 times |
Wed 12 November 2025 |
25.78 (0.08%) |
25.95 |
25.70 - 26.00 |
0.215 times |
Tue 11 November 2025 |
25.76 (0.63%) |
26.09 |
25.76 - 26.09 |
0.0561 times |
Mon 10 November 2025 |
25.60 (-0.39%) |
25.55 |
25.52 - 26.03 |
0.4112 times |
Fri 07 November 2025 |
25.70 (-2.43%) |
25.77 |
25.36 - 25.87 |
1.2336 times |
Weekly price and charts GladstoneInvestment Strong weekly Stock price targets for GladstoneInvestment GAINL are 25.1 and 25.18 | Weekly Target 1 | 25.06 | | Weekly Target 2 | 25.1 | | Weekly Target 3 | 25.14 | | Weekly Target 4 | 25.18 | | Weekly Target 5 | 25.22 |
Weekly price and volumes for Gladstone Investment
| Date |
Closing |
Open |
Range |
Volume |
Fri 21 November 2025 |
25.14 (-0.04%) |
25.14 |
25.10 - 25.18 |
2.3176 times |
Fri 14 November 2025 |
25.15 (-2.14%) |
25.55 |
25.11 - 26.09 |
2.4422 times |
Fri 07 November 2025 |
25.70 (-0.73%) |
25.60 |
25.36 - 26.34 |
0.9831 times |
Fri 31 October 2025 |
25.89 (0%) |
25.95 |
25.68 - 25.95 |
0.347 times |
Fri 31 October 2025 |
25.89 (0.62%) |
25.81 |
25.38 - 25.95 |
0.9386 times |
Fri 24 October 2025 |
25.73 (1.18%) |
25.48 |
25.48 - 25.83 |
0.4448 times |
Fri 17 October 2025 |
25.43 (-1.55%) |
25.94 |
25.34 - 25.94 |
0.6673 times |
Fri 10 October 2025 |
25.83 (-0.08%) |
25.84 |
25.75 - 25.87 |
0.556 times |
Fri 03 October 2025 |
25.85 (1.25%) |
25.50 |
25.50 - 25.85 |
0.6317 times |
Fri 26 September 2025 |
25.53 (-0.39%) |
25.57 |
25.46 - 25.62 |
0.6717 times |
Thu 18 September 2025 |
25.63 (-0.16%) |
25.66 |
25.50 - 25.71 |
0.7295 times |

Monthly price and charts GladstoneInvestment Strong monthly Stock price targets for GladstoneInvestment GAINL are 24.5 and 25.74 | Monthly Target 1 | 24.29 | | Monthly Target 2 | 24.71 | | Monthly Target 3 | 25.526666666667 | | Monthly Target 4 | 25.95 | | Monthly Target 5 | 26.77 |
Monthly price and volumes Gladstone Investment
| Date |
Closing |
Open |
Range |
Volume |
Fri 21 November 2025 |
25.14 (-2.9%) |
25.60 |
25.10 - 26.34 |
1.6906 times |
Fri 31 October 2025 |
25.89 (0.9%) |
25.66 |
25.34 - 25.95 |
0.9534 times |
Tue 30 September 2025 |
25.66 (0.63%) |
25.45 |
25.40 - 25.71 |
1.2637 times |
Fri 29 August 2025 |
25.50 (0.2%) |
25.52 |
25.28 - 25.65 |
1.2585 times |
Thu 31 July 2025 |
25.45 (-0.51%) |
25.55 |
25.44 - 25.89 |
0.7182 times |
Mon 30 June 2025 |
25.58 (-0.54%) |
25.63 |
25.41 - 25.83 |
0.732 times |
Fri 30 May 2025 |
25.72 (1.14%) |
25.37 |
25.32 - 25.90 |
0.4714 times |
Wed 30 April 2025 |
25.43 (-1.93%) |
26.00 |
25.27 - 26.19 |
1.227 times |
Mon 31 March 2025 |
25.93 (1.49%) |
25.69 |
25.55 - 25.99 |
0.703 times |
Fri 28 February 2025 |
25.55 (-1.84%) |
25.96 |
25.50 - 26.00 |
0.9822 times |
Fri 31 January 2025 |
26.03 (0.93%) |
25.84 |
25.10 - 26.12 |
1.2909 times |
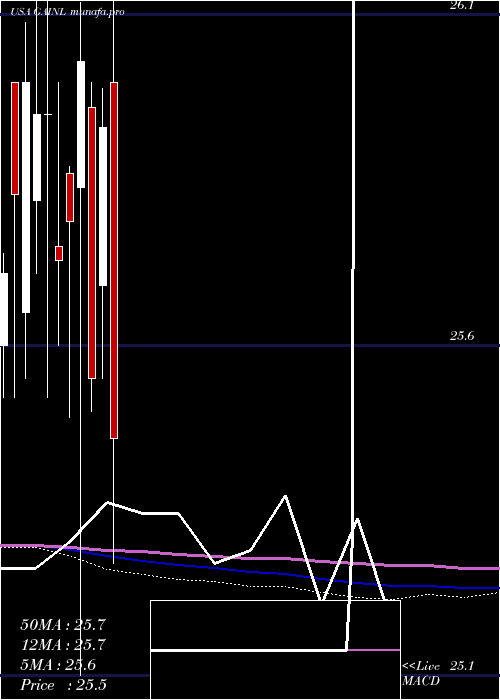
DMA SMA EMA moving averages of Gladstone Investment GAINL
DMA (daily moving average) of Gladstone Investment GAINL
| DMA period | DMA value | | 5 day DMA | 25.14 | | 12 day DMA | 25.48 | | 20 day DMA | 25.58 | | 35 day DMA | 25.61 | | 50 day DMA | 25.62 | | 100 day DMA | 25.57 | | 150 day DMA | 25.57 | | 200 day DMA | 25.61 | EMA (exponential moving average) of Gladstone Investment GAINL
| EMA period | EMA current | EMA prev | EMA prev2 | | 5 day EMA | 25.19 | 25.22 | 25.26 | | 12 day EMA | 25.36 | 25.4 | 25.45 | | 20 day EMA | 25.47 | 25.5 | 25.54 | | 35 day EMA | 25.54 | 25.56 | 25.58 | | 50 day EMA | 25.56 | 25.58 | 25.6 |
SMA (simple moving average) of Gladstone Investment GAINL
| SMA period | SMA current | SMA prev | SMA prev2 | | 5 day SMA | 25.14 | 25.14 | 25.25 | | 12 day SMA | 25.48 | 25.52 | 25.57 | | 20 day SMA | 25.58 | 25.61 | 25.63 | | 35 day SMA | 25.61 | 25.63 | 25.65 | | 50 day SMA | 25.62 | 25.63 | 25.64 | | 100 day SMA | 25.57 | 25.58 | 25.59 | | 150 day SMA | 25.57 | 25.57 | 25.58 | | 200 day SMA | 25.61 | 25.62 | 25.62 |
|
|
