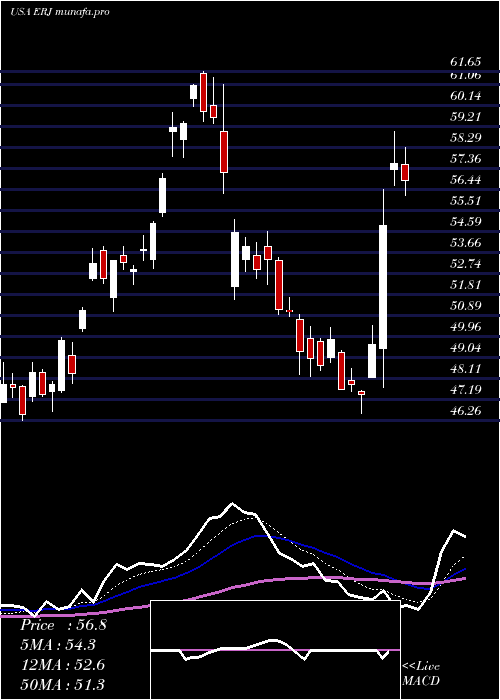
EmbraerS ERJ full analysis,charts,indicators,moving averages,SMA,DMA,EMA,ADX,MACD,RSIEmbraer S ERJ WideScreen charts, DMA,SMA,EMA technical analysis, forecast prediction, by indicators ADX,MACD,RSI,CCI USA stock exchange
operates under Capital Goods sector & deals in Aerospace
Daily price and charts and targets EmbraerS Strong Daily Stock price targets for EmbraerS ERJ are 56.36 and 57.48 | Daily Target 1 | 55.49 | | Daily Target 2 | 56.1 | | Daily Target 3 | 56.61 | | Daily Target 4 | 57.22 | | Daily Target 5 | 57.73 |
Daily price and volume Embraer S
| Date |
Closing |
Open |
Range |
Volume |
Wed 17 September 2025 |
56.71 (-0.72%) |
56.42 |
56.00 - 57.12 |
0.6201 times |
Tue 16 September 2025 |
57.12 (0.28%) |
57.34 |
56.92 - 57.74 |
0.693 times |
Mon 15 September 2025 |
56.96 (-0.63%) |
57.30 |
56.76 - 57.61 |
0.6189 times |
Fri 12 September 2025 |
57.32 (-2.52%) |
58.56 |
57.31 - 58.73 |
0.5949 times |
Thu 11 September 2025 |
58.80 (-0.99%) |
59.70 |
58.70 - 60.14 |
0.9543 times |
Wed 10 September 2025 |
59.39 (-1.33%) |
60.25 |
59.25 - 62.09 |
1.513 times |
Tue 09 September 2025 |
60.19 (-0.2%) |
60.14 |
59.50 - 60.45 |
0.7152 times |
Mon 08 September 2025 |
60.31 (-1.08%) |
61.20 |
59.63 - 61.39 |
1.2882 times |
Fri 05 September 2025 |
60.97 (3.5%) |
59.25 |
59.06 - 61.07 |
1.8019 times |
Thu 04 September 2025 |
58.91 (3.12%) |
57.11 |
56.79 - 58.92 |
1.2006 times |
Wed 03 September 2025 |
57.13 (-0.54%) |
57.39 |
56.66 - 57.97 |
0.7076 times |
Weekly price and charts EmbraerS Strong weekly Stock price targets for EmbraerS ERJ are 55.49 and 57.23 | Weekly Target 1 | 55.08 | | Weekly Target 2 | 55.89 | | Weekly Target 3 | 56.816666666667 | | Weekly Target 4 | 57.63 | | Weekly Target 5 | 58.56 |
Weekly price and volumes for Embraer S
| Date |
Closing |
Open |
Range |
Volume |
Wed 17 September 2025 |
56.71 (-1.06%) |
57.30 |
56.00 - 57.74 |
0.3386 times |
Fri 12 September 2025 |
57.32 (-5.99%) |
61.20 |
57.31 - 62.09 |
0.8877 times |
Fri 05 September 2025 |
60.97 (8.24%) |
55.76 |
55.38 - 61.07 |
0.8395 times |
Fri 29 August 2025 |
56.33 (0%) |
56.17 |
55.29 - 56.37 |
0.1917 times |
Fri 29 August 2025 |
56.33 (-1.05%) |
56.80 |
55.29 - 57.39 |
0.7316 times |
Fri 22 August 2025 |
56.93 (-1.03%) |
57.21 |
54.44 - 58.44 |
1.0362 times |
Fri 15 August 2025 |
57.52 (-1.49%) |
57.58 |
56.22 - 60.02 |
0.9322 times |
Fri 08 August 2025 |
58.39 (2.73%) |
60.00 |
56.14 - 60.42 |
1.0719 times |
Fri 01 August 2025 |
56.84 (18.81%) |
47.50 |
46.54 - 59.02 |
2.8586 times |
Fri 25 July 2025 |
47.84 (-2.96%) |
49.84 |
47.50 - 50.41 |
1.1119 times |
Fri 18 July 2025 |
49.30 (-8.57%) |
53.50 |
48.28 - 54.60 |
1.7554 times |

Monthly price and charts EmbraerS Strong monthly Stock price targets for EmbraerS ERJ are 56.05 and 62.76 | Monthly Target 1 | 51.35 | | Monthly Target 2 | 54.03 | | Monthly Target 3 | 58.06 | | Monthly Target 4 | 60.74 | | Monthly Target 5 | 64.77 |
Monthly price and volumes Embraer S
| Date |
Closing |
Open |
Range |
Volume |
Wed 17 September 2025 |
56.71 (0.67%) |
55.76 |
55.38 - 62.09 |
0.5355 times |
Fri 29 August 2025 |
56.33 (-2.17%) |
57.55 |
54.44 - 60.42 |
1.1191 times |
Thu 31 July 2025 |
57.58 (1.18%) |
59.02 |
46.54 - 61.65 |
2.026 times |
Mon 30 June 2025 |
56.91 (23.74%) |
46.52 |
45.90 - 57.12 |
0.7787 times |
Fri 30 May 2025 |
45.99 (0.11%) |
45.92 |
43.80 - 50.45 |
0.7543 times |
Wed 30 April 2025 |
45.94 (-0.56%) |
45.22 |
38.78 - 48.50 |
1.1012 times |
Mon 31 March 2025 |
46.20 (-3.04%) |
48.40 |
44.45 - 56.61 |
1.4617 times |
Fri 28 February 2025 |
47.65 (16.3%) |
39.75 |
39.27 - 48.40 |
1.1525 times |
Fri 31 January 2025 |
40.97 (11.7%) |
36.71 |
36.67 - 41.90 |
0.7022 times |
Tue 31 December 2024 |
36.68 (-8.3%) |
37.94 |
34.88 - 38.52 |
0.369 times |
Tue 26 November 2024 |
40.00 (19.33%) |
33.47 |
33.06 - 40.34 |
0.8934 times |

DMA SMA EMA moving averages of Embraer S ERJ
DMA (daily moving average) of Embraer S ERJ
| DMA period | DMA value | | 5 day DMA | 57.38 | | 12 day DMA | 58.44 | | 20 day DMA | 57.58 | | 35 day DMA | 57.53 | | 50 day DMA | 55.54 | | 100 day DMA | 52.65 | | 150 day DMA | 50.46 | | 200 day DMA | 47.54 | EMA (exponential moving average) of Embraer S ERJ
| EMA period | EMA current | EMA prev | EMA prev2 | | 5 day EMA | 57.4 | 57.75 | 58.06 | | 12 day EMA | 57.79 | 57.99 | 58.15 | | 20 day EMA | 57.66 | 57.76 | 57.83 | | 35 day EMA | 56.88 | 56.89 | 56.88 | | 50 day EMA | 56.07 | 56.04 | 56 |
SMA (simple moving average) of Embraer S ERJ
| SMA period | SMA current | SMA prev | SMA prev2 | | 5 day SMA | 57.38 | 57.92 | 58.53 | | 12 day SMA | 58.44 | 58.41 | 58.34 | | 20 day SMA | 57.58 | 57.53 | 57.47 | | 35 day SMA | 57.53 | 57.33 | 57.05 | | 50 day SMA | 55.54 | 55.6 | 55.65 | | 100 day SMA | 52.65 | 52.51 | 52.36 | | 150 day SMA | 50.46 | 50.36 | 50.26 | | 200 day SMA | 47.54 | 47.45 | 47.36 |
|
|
