EssaPharma EPIX full analysis,charts,indicators,moving averages,SMA,DMA,EMA,ADX,MACD,RSIEssa Pharma EPIX WideScreen charts, DMA,SMA,EMA technical analysis, forecast prediction, by indicators ADX,MACD,RSI,CCI USA stock exchange
operates under Health Care sector & deals in Major Pharmaceuticals
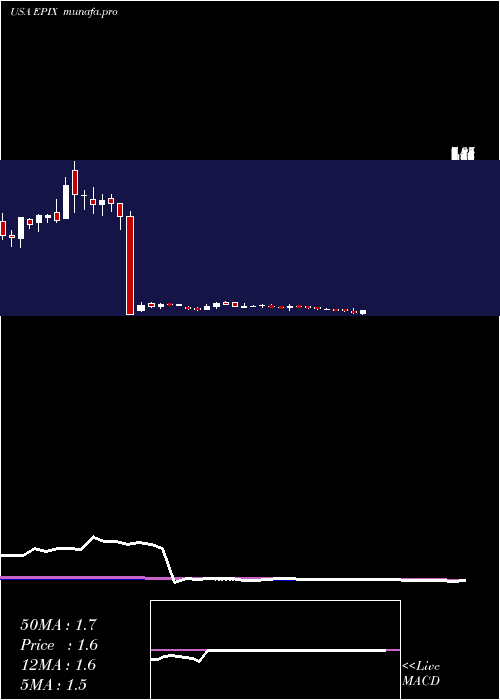
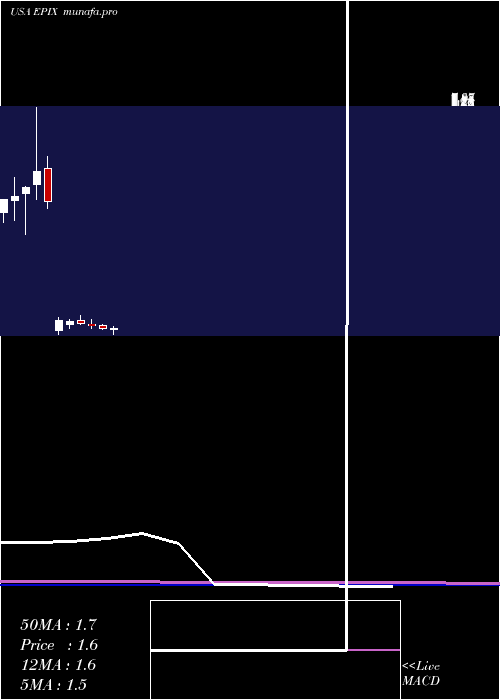
Daily price and charts and targets EssaPharma Strong Daily Stock price targets for EssaPharma EPIX are 0.21 and 0.22 | Daily Target 1 | 0.2 | | Daily Target 2 | 0.2 | | Daily Target 3 | 0.20666666666667 | | Daily Target 4 | 0.21 | | Daily Target 5 | 0.22 |
Daily price and volume Essa Pharma
| Date |
Closing |
Open |
Range |
Volume |
Thu 18 September 2025 |
0.21 (5%) |
0.21 |
0.20 - 0.21 |
1.0027 times |
Wed 17 September 2025 |
0.20 (5.26%) |
0.21 |
0.20 - 0.21 |
0.6284 times |
Tue 16 September 2025 |
0.19 (0%) |
0.20 |
0.19 - 0.20 |
0.6093 times |
Mon 15 September 2025 |
0.19 (-5%) |
0.20 |
0.19 - 0.21 |
0.7248 times |
Fri 12 September 2025 |
0.20 (-4.76%) |
0.21 |
0.20 - 0.21 |
0.5742 times |
Thu 11 September 2025 |
0.21 (0%) |
0.21 |
0.20 - 0.21 |
0.7306 times |
Wed 10 September 2025 |
0.21 (-12.5%) |
0.24 |
0.19 - 0.24 |
3.3627 times |
Tue 09 September 2025 |
0.24 (0%) |
0.23 |
0.23 - 0.25 |
0.8614 times |
Mon 08 September 2025 |
0.24 (4.35%) |
0.23 |
0.23 - 0.24 |
0.8061 times |
Fri 05 September 2025 |
0.23 (0%) |
0.23 |
0.23 - 0.24 |
0.6998 times |
Thu 04 September 2025 |
0.23 (-4.17%) |
0.23 |
0.23 - 0.24 |
1.0087 times |

Weekly price and charts EssaPharma Strong weekly Stock price targets for EssaPharma EPIX are 0.2 and 0.22 | Weekly Target 1 | 0.18 | | Weekly Target 2 | 0.2 | | Weekly Target 3 | 0.20333333333333 | | Weekly Target 4 | 0.22 | | Weekly Target 5 | 0.22 |
Weekly price and volumes for Essa Pharma
| Date |
Closing |
Open |
Range |
Volume |
Thu 18 September 2025 |
0.21 (5%) |
0.20 |
0.19 - 0.21 |
0.2313 times |
Fri 12 September 2025 |
0.20 (-13.04%) |
0.23 |
0.19 - 0.25 |
0.4943 times |
Fri 05 September 2025 |
0.23 (-4.17%) |
0.23 |
0.23 - 0.25 |
0.387 times |
Fri 29 August 2025 |
0.24 (0%) |
0.23 |
0.23 - 0.26 |
0.2572 times |
Fri 29 August 2025 |
0.24 (-87.56%) |
0.74 |
0.22 - 0.83 |
8.3593 times |
Fri 22 August 2025 |
1.93 (0%) |
1.92 |
1.91 - 1.94 |
0.116 times |
Fri 15 August 2025 |
1.93 (1.05%) |
1.90 |
1.90 - 1.93 |
0.0448 times |
Fri 08 August 2025 |
1.91 (1.6%) |
1.88 |
1.87 - 1.91 |
0.0593 times |
Fri 01 August 2025 |
1.88 (0%) |
1.87 |
1.87 - 1.89 |
0.0231 times |
Fri 25 July 2025 |
1.88 (0%) |
1.87 |
1.86 - 1.88 |
0.0277 times |
Fri 18 July 2025 |
1.88 (9.94%) |
1.87 |
1.85 - 1.88 |
0.1395 times |
Monthly price and charts EssaPharma Strong monthly Stock price targets for EssaPharma EPIX are 0.17 and 0.23 | Monthly Target 1 | 0.16 | | Monthly Target 2 | 0.18 | | Monthly Target 3 | 0.21666666666667 | | Monthly Target 4 | 0.24 | | Monthly Target 5 | 0.28 |
Monthly price and volumes Essa Pharma
| Date |
Closing |
Open |
Range |
Volume |
Thu 18 September 2025 |
0.21 (-12.5%) |
0.23 |
0.19 - 0.25 |
1.0243 times |
Fri 29 August 2025 |
0.24 (-87.23%) |
1.88 |
0.22 - 1.94 |
8.1387 times |
Thu 31 July 2025 |
1.88 (10.59%) |
1.71 |
1.67 - 1.89 |
0.1821 times |
Mon 30 June 2025 |
1.70 (1.19%) |
1.68 |
1.66 - 1.75 |
0.026 times |
Fri 30 May 2025 |
1.68 (-7.69%) |
1.80 |
1.60 - 1.81 |
0.0702 times |
Wed 30 April 2025 |
1.82 (15.19%) |
1.55 |
1.42 - 1.91 |
0.1228 times |
Mon 31 March 2025 |
1.58 (-5.95%) |
1.68 |
1.54 - 1.70 |
0.0412 times |
Fri 28 February 2025 |
1.68 (-2.33%) |
1.70 |
1.57 - 1.83 |
0.1098 times |
Fri 31 January 2025 |
1.72 (-3.91%) |
1.82 |
1.69 - 1.95 |
0.1144 times |
Tue 31 December 2024 |
1.79 (-1.1%) |
1.70 |
1.57 - 1.84 |
0.1706 times |
Tue 26 November 2024 |
1.81 (-65.19%) |
1.53 |
1.40 - 1.89 |
1.2053 times |
DMA SMA EMA moving averages of Essa Pharma EPIX
DMA (daily moving average) of Essa Pharma EPIX
| DMA period | DMA value | | 5 day DMA | 0.2 | | 12 day DMA | 0.22 | | 20 day DMA | 0.34 | | 35 day DMA | 1.01 | | 50 day DMA | 1.26 | | 100 day DMA | 1.49 | | 150 day DMA | 1.54 | | 200 day DMA | 1.59 | EMA (exponential moving average) of Essa Pharma EPIX
| EMA period | EMA current | EMA prev | EMA prev2 | | 5 day EMA | 0.2 | 0.2 | 0.2 | | 12 day EMA | 0.29 | 0.31 | 0.33 | | 20 day EMA | 0.48 | 0.51 | 0.54 | | 35 day EMA | 0.78 | 0.81 | 0.85 | | 50 day EMA | 1.19 | 1.23 | 1.27 |
SMA (simple moving average) of Essa Pharma EPIX
| SMA period | SMA current | SMA prev | SMA prev2 | | 5 day SMA | 0.2 | 0.2 | 0.2 | | 12 day SMA | 0.22 | 0.22 | 0.22 | | 20 day SMA | 0.34 | 0.42 | 0.51 | | 35 day SMA | 1.01 | 1.06 | 1.11 | | 50 day SMA | 1.26 | 1.29 | 1.32 | | 100 day SMA | 1.49 | 1.5 | 1.52 | | 150 day SMA | 1.54 | 1.55 | 1.56 | | 200 day SMA | 1.59 | 1.6 | 1.6 |
|
|
