EnterpriseBancorp EBTC full analysis,charts,indicators,moving averages,SMA,DMA,EMA,ADX,MACD,RSIEnterprise Bancorp EBTC WideScreen charts, DMA,SMA,EMA technical analysis, forecast prediction, by indicators ADX,MACD,RSI,CCI USA stock exchange
operates under Finance sector & deals in Major Banks
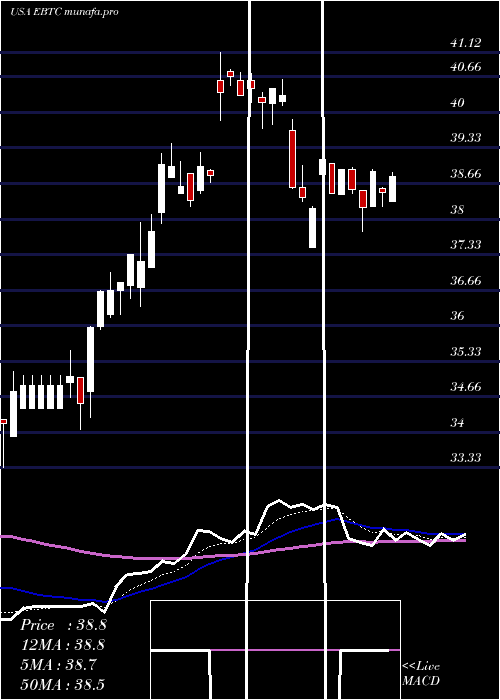
Daily price and charts and targets EnterpriseBancorp Strong Daily Stock price targets for EnterpriseBancorp EBTC are 38.56 and 39.25 | Daily Target 1 | 37.99 | | Daily Target 2 | 38.44 | | Daily Target 3 | 38.683333333333 | | Daily Target 4 | 39.13 | | Daily Target 5 | 39.37 |
Daily price and volume Enterprise Bancorp
| Date |
Closing |
Open |
Range |
Volume |
| Tue 03 June 2025 |
38.88 (1.75%) |
38.24 |
38.24 - 38.93 |
0.5266 times |
| Mon 02 June 2025 |
38.21 (-0.88%) |
38.53 |
37.77 - 38.53 |
1.4293 times |
| Fri 30 May 2025 |
38.55 (-0.95%) |
38.92 |
38.48 - 38.96 |
1.7464 times |
| Thu 29 May 2025 |
38.92 (1.17%) |
38.45 |
38.45 - 38.92 |
0.9457 times |
| Wed 28 May 2025 |
38.47 (-1.64%) |
39.03 |
38.47 - 39.03 |
0.7738 times |
| Tue 27 May 2025 |
39.11 (2.41%) |
38.84 |
38.18 - 39.11 |
0.9995 times |
| Fri 23 May 2025 |
38.19 (-0.52%) |
37.46 |
37.46 - 38.23 |
0.7308 times |
| Thu 22 May 2025 |
38.39 (-0.49%) |
38.59 |
38.33 - 39.00 |
1.1392 times |
| Wed 21 May 2025 |
38.58 (-4.32%) |
39.66 |
38.56 - 39.86 |
0.849 times |
| Tue 20 May 2025 |
40.32 (-0.32%) |
40.20 |
40.13 - 40.61 |
0.8598 times |
| Mon 19 May 2025 |
40.45 (0.65%) |
40.17 |
39.76 - 40.45 |
0.72 times |
Weekly price and charts EnterpriseBancorp Strong weekly Stock price targets for EnterpriseBancorp EBTC are 38.33 and 39.49 | Weekly Target 1 | 37.37 | | Weekly Target 2 | 38.12 | | Weekly Target 3 | 38.526666666667 | | Weekly Target 4 | 39.28 | | Weekly Target 5 | 39.69 |
Weekly price and volumes for Enterprise Bancorp
| Date |
Closing |
Open |
Range |
Volume |
| Tue 03 June 2025 |
38.88 (0.86%) |
38.53 |
37.77 - 38.93 |
0.5065 times |
| Fri 30 May 2025 |
38.55 (0.94%) |
38.84 |
38.18 - 39.11 |
1.1564 times |
| Fri 23 May 2025 |
38.19 (-4.98%) |
40.17 |
37.46 - 40.61 |
1.1132 times |
| Fri 16 May 2025 |
40.19 (3.53%) |
40.60 |
39.69 - 41.12 |
3.0433 times |
| Fri 09 May 2025 |
38.82 (-0.51%) |
38.77 |
38.23 - 39.41 |
0.9142 times |
| Fri 02 May 2025 |
39.02 (6.44%) |
36.65 |
36.21 - 39.23 |
1.5724 times |
| Fri 25 April 2025 |
36.66 (4.65%) |
35.02 |
34.05 - 37.00 |
1.0047 times |
| Thu 17 April 2025 |
35.03 (0.43%) |
34.44 |
34.44 - 35.53 |
0.42 times |
| Wed 16 April 2025 |
34.88 (0%) |
34.44 |
34.44 - 35.07 |
0.2692 times |
| Wed 16 April 2025 |
34.88 (0%) |
34.44 |
34.44 - 35.07 |
0 times |
| Wed 16 April 2025 |
34.88 (0%) |
34.44 |
34.44 - 35.07 |
0 times |
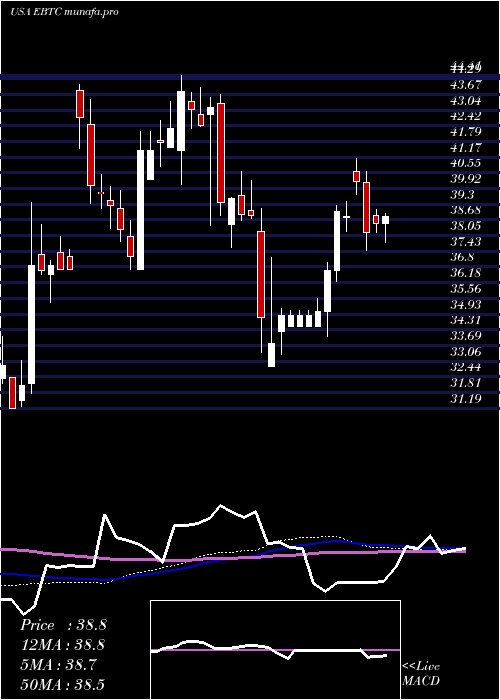
Monthly price and charts EnterpriseBancorp Strong monthly Stock price targets for EnterpriseBancorp EBTC are 38.33 and 39.49 | Monthly Target 1 | 37.37 | | Monthly Target 2 | 38.12 | | Monthly Target 3 | 38.526666666667 | | Monthly Target 4 | 39.28 | | Monthly Target 5 | 39.69 |
Monthly price and volumes Enterprise Bancorp
| Date |
Closing |
Open |
Range |
Volume |
| Tue 03 June 2025 |
38.88 (0.86%) |
38.53 |
37.77 - 38.93 |
0.0638 times |
| Fri 30 May 2025 |
38.55 (3.63%) |
37.09 |
37.09 - 41.12 |
0.865 times |
| Wed 30 April 2025 |
37.20 (-4.44%) |
38.55 |
32.86 - 39.14 |
1.0832 times |
| Mon 31 March 2025 |
38.93 (-9.78%) |
43.29 |
37.58 - 43.65 |
1.1406 times |
| Fri 28 February 2025 |
43.15 (1.94%) |
41.42 |
38.45 - 44.41 |
1.0018 times |
| Fri 31 January 2025 |
42.33 (7.06%) |
39.62 |
36.69 - 43.38 |
1.6752 times |
| Tue 31 December 2024 |
39.54 (7.74%) |
43.84 |
39.13 - 44.07 |
1.939 times |
| Tue 26 November 2024 |
36.70 (14.29%) |
31.60 |
31.25 - 39.37 |
0.6424 times |
| Thu 31 October 2024 |
32.11 (0.47%) |
32.02 |
30.49 - 34.03 |
0.6412 times |
| Mon 30 September 2024 |
31.96 (3.13%) |
30.72 |
29.38 - 32.77 |
0.9477 times |
| Fri 30 August 2024 |
30.99 (4.87%) |
28.95 |
25.49 - 31.16 |
0.8992 times |

DMA SMA EMA moving averages of Enterprise Bancorp EBTC
DMA (daily moving average) of Enterprise Bancorp EBTC
| DMA period | DMA value | | 5 day DMA | 38.61 | | 12 day DMA | 39.02 | | 20 day DMA | 39.24 | | 35 day DMA | 38.01 | | 50 day DMA | 37.48 | | 100 day DMA | 39.43 | | 150 day DMA | 38.73 | | 200 day DMA | 36.75 | EMA (exponential moving average) of Enterprise Bancorp EBTC
| EMA period | EMA current | EMA prev | EMA prev2 | | 5 day EMA | 38.67 | 38.56 | 38.74 | | 12 day EMA | 38.84 | 38.83 | 38.94 | | 20 day EMA | 38.74 | 38.73 | 38.79 | | 35 day EMA | 38.36 | 38.33 | 38.34 | | 50 day EMA | 37.76 | 37.71 | 37.69 |
SMA (simple moving average) of Enterprise Bancorp EBTC
| SMA period | SMA current | SMA prev | SMA prev2 | | 5 day SMA | 38.61 | 38.65 | 38.65 | | 12 day SMA | 39.02 | 39.15 | 39.33 | | 20 day SMA | 39.24 | 39.25 | 39.29 | | 35 day SMA | 38.01 | 37.89 | 37.79 | | 50 day SMA | 37.48 | 37.48 | 37.5 | | 100 day SMA | 39.43 | 39.42 | 39.42 | | 150 day SMA | 38.73 | 38.69 | 38.67 | | 200 day SMA | 36.75 | 36.69 | 36.64 |
|
|
