MrCooper COOP full analysis,charts,indicators,moving averages,SMA,DMA,EMA,ADX,MACD,RSIMr Cooper COOP WideScreen charts, DMA,SMA,EMA technical analysis, forecast prediction, by indicators ADX,MACD,RSI,CCI USA stock exchange
operates under Finance sector & deals in Finance Consumer Services
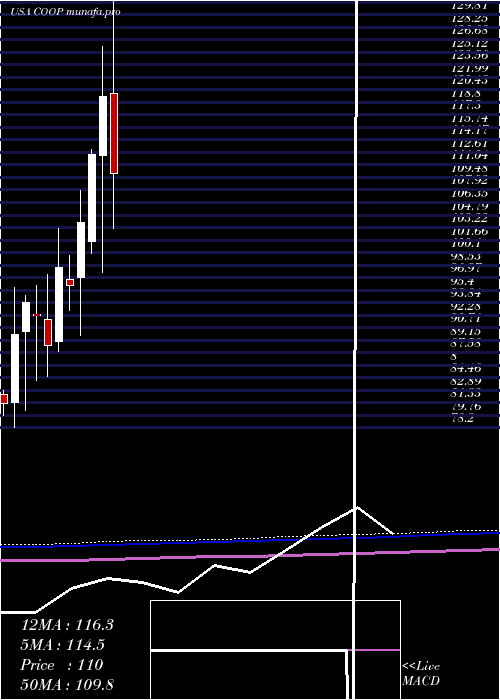
Daily price and charts and targets MrCooper Strong Daily Stock price targets for MrCooper COOP are 216.45 and 232.82 | Daily Target 1 | 204.05 | | Daily Target 2 | 212.48 | | Daily Target 3 | 220.42333333333 | | Daily Target 4 | 228.85 | | Daily Target 5 | 236.79 |
Daily price and volume Mr Cooper
| Date |
Closing |
Open |
Range |
Volume |
Wed 17 September 2025 |
220.90 (2.16%) |
218.00 |
212.00 - 228.37 |
1.0531 times |
Tue 16 September 2025 |
216.22 (-1.63%) |
219.01 |
210.29 - 219.49 |
0.8893 times |
Mon 15 September 2025 |
219.80 (-0.25%) |
223.62 |
218.96 - 226.65 |
0.6966 times |
Fri 12 September 2025 |
220.35 (0.3%) |
219.06 |
216.14 - 223.74 |
0.6563 times |
Thu 11 September 2025 |
219.70 (0.78%) |
223.46 |
218.34 - 234.73 |
1.7025 times |
Wed 10 September 2025 |
218.00 (1.26%) |
222.71 |
216.59 - 231.52 |
1.2835 times |
Tue 09 September 2025 |
215.29 (0.1%) |
213.26 |
209.83 - 215.97 |
0.5466 times |
Mon 08 September 2025 |
215.08 (0.92%) |
213.67 |
210.11 - 215.66 |
0.9109 times |
Fri 05 September 2025 |
213.11 (5.18%) |
210.00 |
205.00 - 216.79 |
1.311 times |
Thu 04 September 2025 |
202.61 (7.07%) |
190.22 |
190.22 - 203.26 |
0.9503 times |
Wed 03 September 2025 |
189.24 (3.81%) |
182.83 |
181.43 - 190.53 |
0.707 times |
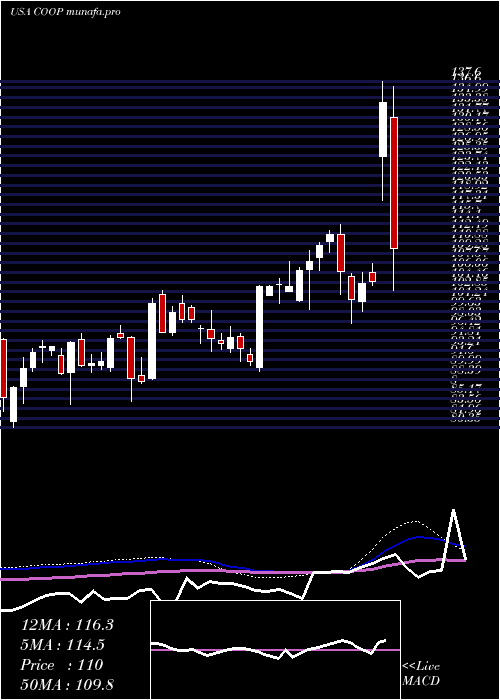
Weekly price and charts MrCooper Strong weekly Stock price targets for MrCooper COOP are 206.56 and 224.64 | Weekly Target 1 | 201.77 | | Weekly Target 2 | 211.34 | | Weekly Target 3 | 219.85333333333 | | Weekly Target 4 | 229.42 | | Weekly Target 5 | 237.93 |
Weekly price and volumes for Mr Cooper
| Date |
Closing |
Open |
Range |
Volume |
Wed 17 September 2025 |
220.90 (0.25%) |
223.62 |
210.29 - 228.37 |
0.5111 times |
Fri 12 September 2025 |
220.35 (3.4%) |
213.67 |
209.83 - 234.73 |
0.9877 times |
Fri 05 September 2025 |
213.11 (13.04%) |
183.26 |
176.00 - 216.79 |
0.833 times |
Fri 29 August 2025 |
188.53 (0%) |
189.96 |
187.01 - 191.88 |
0.205 times |
Fri 29 August 2025 |
188.53 (-5.25%) |
197.98 |
184.90 - 199.11 |
1.0077 times |
Fri 22 August 2025 |
198.98 (4.03%) |
191.11 |
178.54 - 202.24 |
0.8347 times |
Fri 15 August 2025 |
191.27 (7.85%) |
177.36 |
177.36 - 203.42 |
1.1447 times |
Fri 08 August 2025 |
177.35 (1.77%) |
178.95 |
176.91 - 193.86 |
0.9765 times |
Fri 01 August 2025 |
174.26 (10.9%) |
156.01 |
152.70 - 180.57 |
1.2849 times |
Fri 25 July 2025 |
157.13 (4.45%) |
153.20 |
152.98 - 178.89 |
2.2145 times |
Fri 18 July 2025 |
150.43 (2.33%) |
147.17 |
142.22 - 151.97 |
0.9589 times |
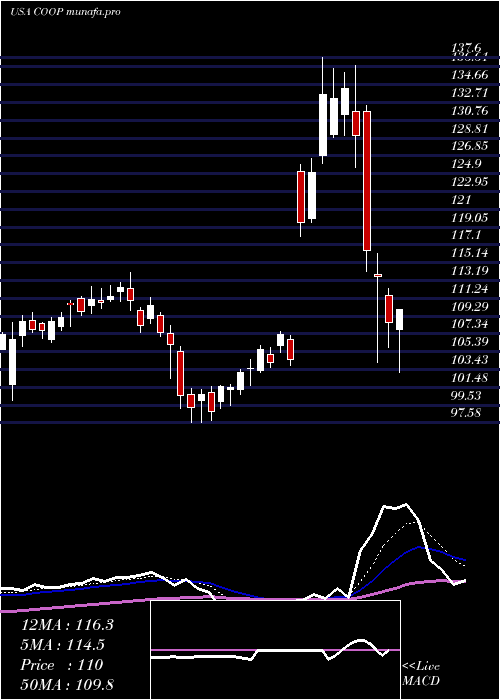
Monthly price and charts MrCooper Strong monthly Stock price targets for MrCooper COOP are 198.45 and 257.18 | Monthly Target 1 | 151.81 | | Monthly Target 2 | 186.36 | | Monthly Target 3 | 210.54333333333 | | Monthly Target 4 | 245.09 | | Monthly Target 5 | 269.27 |
Monthly price and volumes Mr Cooper
| Date |
Closing |
Open |
Range |
Volume |
Wed 17 September 2025 |
220.90 (17.17%) |
183.26 |
176.00 - 234.73 |
0.5278 times |
Fri 29 August 2025 |
188.53 (21.07%) |
163.72 |
163.35 - 203.42 |
1.0611 times |
Thu 31 July 2025 |
155.72 (4.36%) |
148.22 |
141.63 - 178.89 |
1.4078 times |
Mon 30 June 2025 |
149.21 (15.19%) |
128.89 |
124.45 - 156.35 |
1.6349 times |
Fri 30 May 2025 |
129.53 (8.84%) |
118.73 |
114.26 - 138.35 |
1.0677 times |
Wed 30 April 2025 |
119.01 (-0.49%) |
119.99 |
103.15 - 137.60 |
1.5888 times |
Mon 31 March 2025 |
119.60 (6.43%) |
112.26 |
97.58 - 125.86 |
1.0924 times |
Fri 28 February 2025 |
112.37 (8.25%) |
101.49 |
100.00 - 112.99 |
0.5879 times |
Fri 31 January 2025 |
103.81 (8.12%) |
96.96 |
89.70 - 107.85 |
0.6443 times |
Tue 31 December 2024 |
96.01 (-2.32%) |
96.74 |
92.88 - 99.70 |
0.3873 times |
Tue 26 November 2024 |
98.29 (11%) |
88.95 |
87.70 - 103.05 |
0.5617 times |
DMA SMA EMA moving averages of Mr Cooper COOP
DMA (daily moving average) of Mr Cooper COOP
| DMA period | DMA value | | 5 day DMA | 219.39 | | 12 day DMA | 211.05 | | 20 day DMA | 202.87 | | 35 day DMA | 194.51 | | 50 day DMA | 182.44 | | 100 day DMA | 157.87 | | 150 day DMA | 142.2 | | 200 day DMA | 131.37 | EMA (exponential moving average) of Mr Cooper COOP
| EMA period | EMA current | EMA prev | EMA prev2 | | 5 day EMA | 218.33 | 217.04 | 217.45 | | 12 day EMA | 212.11 | 210.51 | 209.47 | | 20 day EMA | 205.46 | 203.83 | 202.53 | | 35 day EMA | 193.85 | 192.26 | 190.85 | | 50 day EMA | 183.41 | 181.88 | 180.48 |
SMA (simple moving average) of Mr Cooper COOP
| SMA period | SMA current | SMA prev | SMA prev2 | | 5 day SMA | 219.39 | 218.81 | 218.63 | | 12 day SMA | 211.05 | 208.35 | 206.04 | | 20 day SMA | 202.87 | 201.1 | 199.85 | | 35 day SMA | 194.51 | 192.76 | 191.1 | | 50 day SMA | 182.44 | 180.95 | 179.51 | | 100 day SMA | 157.87 | 156.78 | 155.69 | | 150 day SMA | 142.2 | 141.44 | 140.71 | | 200 day SMA | 131.37 | 130.76 | 130.16 |
|
|
