ChesapeakeEnergy CHK full analysis,charts,indicators,moving averages,SMA,DMA,EMA,ADX,MACD,RSIChesapeake Energy CHK WideScreen charts, DMA,SMA,EMA technical analysis, forecast prediction, by indicators ADX,MACD,RSI,CCI USA stock exchange
operates under Energy sector & deals in Oil Gas Production
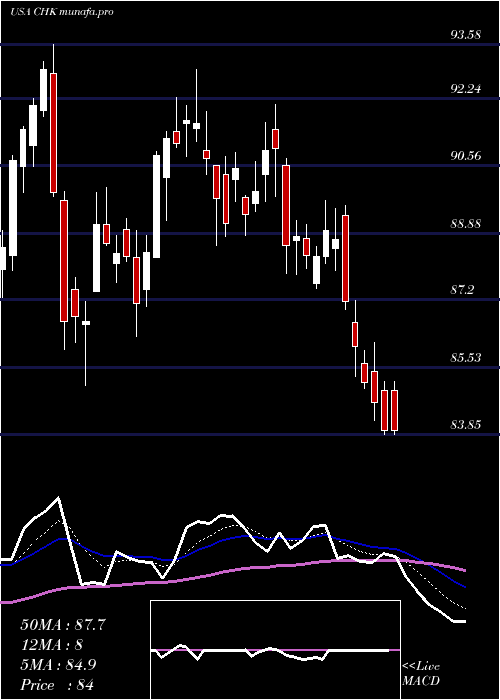
Daily price and charts and targets ChesapeakeEnergy Strong Daily Stock price targets for ChesapeakeEnergy CHK are 91.24 and 92.52 | Daily Target 1 | 90.23 | | Daily Target 2 | 90.96 | | Daily Target 3 | 91.51 | | Daily Target 4 | 92.24 | | Daily Target 5 | 92.79 |
Daily price and volume Chesapeake Energy
| Date |
Closing |
Open |
Range |
Volume |
Fri 17 May 2024 |
91.69 (0.64%) |
91.61 |
90.78 - 92.06 |
0.656 times |
Thu 16 May 2024 |
91.11 (-0.15%) |
91.41 |
91.01 - 92.28 |
0.9499 times |
Wed 15 May 2024 |
91.25 (0.48%) |
90.27 |
89.20 - 91.42 |
1.2808 times |
Tue 14 May 2024 |
90.81 (2.74%) |
88.28 |
88.28 - 90.91 |
1.1932 times |
Mon 13 May 2024 |
88.39 (1.46%) |
87.46 |
87.05 - 88.81 |
0.9141 times |
Fri 10 May 2024 |
87.12 (-1.34%) |
88.27 |
86.29 - 88.95 |
0.8056 times |
Thu 09 May 2024 |
88.30 (-0.08%) |
88.96 |
88.17 - 89.23 |
0.8983 times |
Wed 08 May 2024 |
88.37 (-0.28%) |
88.13 |
87.65 - 88.82 |
0.7643 times |
Tue 07 May 2024 |
88.62 (-0.52%) |
89.08 |
88.58 - 90.02 |
1.2586 times |
Mon 06 May 2024 |
89.08 (2.78%) |
87.42 |
87.42 - 89.89 |
1.2792 times |
Fri 03 May 2024 |
86.67 (-0.14%) |
86.61 |
85.08 - 87.16 |
1.8141 times |
Weekly price and charts ChesapeakeEnergy Strong weekly Stock price targets for ChesapeakeEnergy CHK are 89.37 and 94.6 | Weekly Target 1 | 85.11 | | Weekly Target 2 | 88.4 | | Weekly Target 3 | 90.34 | | Weekly Target 4 | 93.63 | | Weekly Target 5 | 95.57 |
Weekly price and volumes for Chesapeake Energy
| Date |
Closing |
Open |
Range |
Volume |
Fri 17 May 2024 |
91.69 (5.25%) |
87.46 |
87.05 - 92.28 |
0.8708 times |
Fri 10 May 2024 |
87.12 (0.52%) |
87.42 |
86.29 - 90.02 |
0.8729 times |
Fri 03 May 2024 |
86.67 (-5.85%) |
91.93 |
85.08 - 93.58 |
1.4592 times |
Fri 26 April 2024 |
92.06 (5.2%) |
87.13 |
86.62 - 92.25 |
0.8033 times |
Fri 19 April 2024 |
87.51 (-1.22%) |
88.75 |
85.45 - 89.24 |
0.7135 times |
Fri 12 April 2024 |
88.59 (-1.03%) |
89.60 |
87.20 - 90.74 |
0.8871 times |
Fri 05 April 2024 |
89.51 (0.77%) |
89.34 |
87.99 - 91.03 |
0.7978 times |
Thu 28 March 2024 |
88.83 (2.92%) |
86.55 |
85.23 - 89.12 |
0.7706 times |
Fri 22 March 2024 |
86.31 (3.4%) |
83.68 |
82.81 - 86.91 |
0.8575 times |
Fri 15 March 2024 |
83.47 (1.78%) |
81.89 |
81.27 - 85.47 |
1.9672 times |
Fri 08 March 2024 |
82.01 (-0.97%) |
83.91 |
81.23 - 84.26 |
0.948 times |
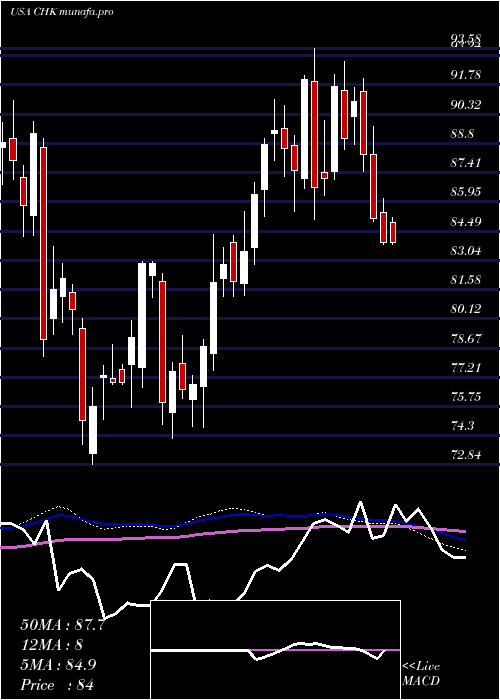
Monthly price and charts ChesapeakeEnergy Strong monthly Stock price targets for ChesapeakeEnergy CHK are 88.39 and 95.59 | Monthly Target 1 | 82.48 | | Monthly Target 2 | 87.09 | | Monthly Target 3 | 89.683333333333 | | Monthly Target 4 | 94.29 | | Monthly Target 5 | 96.88 |
Monthly price and volumes Chesapeake Energy
| Date |
Closing |
Open |
Range |
Volume |
Fri 17 May 2024 |
91.69 (2.01%) |
89.70 |
85.08 - 92.28 |
0.6296 times |
Tue 30 April 2024 |
89.88 (1.18%) |
89.34 |
85.45 - 93.58 |
0.8434 times |
Thu 28 March 2024 |
88.83 (7.31%) |
83.29 |
81.23 - 89.12 |
1.0843 times |
Thu 29 February 2024 |
82.78 (7.35%) |
77.23 |
74.70 - 84.33 |
1.0573 times |
Wed 31 January 2024 |
77.11 (0.22%) |
77.86 |
74.18 - 83.00 |
1.4293 times |
Fri 29 December 2023 |
76.94 (-4.2%) |
79.95 |
72.84 - 81.15 |
0.8682 times |
Thu 30 November 2023 |
80.31 (-6.7%) |
88.00 |
78.27 - 89.95 |
0.8529 times |
Tue 31 October 2023 |
86.08 (-0.17%) |
85.97 |
80.75 - 91.00 |
0.8702 times |
Fri 29 September 2023 |
86.23 (-2.24%) |
89.43 |
81.84 - 90.60 |
0.7409 times |
Thu 31 August 2023 |
88.21 (4.59%) |
83.36 |
81.10 - 89.06 |
1.6239 times |
Mon 31 July 2023 |
84.34 (0.79%) |
83.70 |
79.74 - 85.09 |
0.6036 times |

DMA SMA EMA moving averages of Chesapeake Energy CHK
DMA (daily moving average) of Chesapeake Energy CHK
| DMA period | DMA value | | 5 day DMA | 90.65 | | 12 day DMA | 89.02 | | 20 day DMA | 89.44 | | 35 day DMA | 89.15 | | 50 day DMA | 87.96 | | 100 day DMA | 83.32 | | 150 day DMA | 82.65 | | 200 day DMA | 83.52 | EMA (exponential moving average) of Chesapeake Energy CHK
| EMA period | EMA current | EMA prev | EMA prev2 | | 5 day EMA | 90.7 | 90.2 | 89.75 | | 12 day EMA | 89.78 | 89.43 | 89.13 | | 20 day EMA | 89.34 | 89.09 | 88.88 | | 35 day EMA | 88.5 | 88.31 | 88.15 | | 50 day EMA | 87.77 | 87.61 | 87.47 |
SMA (simple moving average) of Chesapeake Energy CHK
| SMA period | SMA current | SMA prev | SMA prev2 | | 5 day SMA | 90.65 | 89.74 | 89.17 | | 12 day SMA | 89.02 | 88.6 | 88.5 | | 20 day SMA | 89.44 | 89.24 | 89.05 | | 35 day SMA | 89.15 | 89.07 | 88.97 | | 50 day SMA | 87.96 | 87.76 | 87.58 | | 100 day SMA | 83.32 | 83.19 | 83.05 | | 150 day SMA | 82.65 | 82.63 | 82.62 | | 200 day SMA | 83.52 | 83.49 | 83.47 |
|
|
