AdtalemGlobal ATGE full analysis,charts,indicators,moving averages,SMA,DMA,EMA,ADX,MACD,RSIAdtalem Global ATGE WideScreen charts, DMA,SMA,EMA technical analysis, forecast prediction, by indicators ADX,MACD,RSI,CCI USA stock exchange
operates under Consumer Services sector & deals in Other Consumer Services
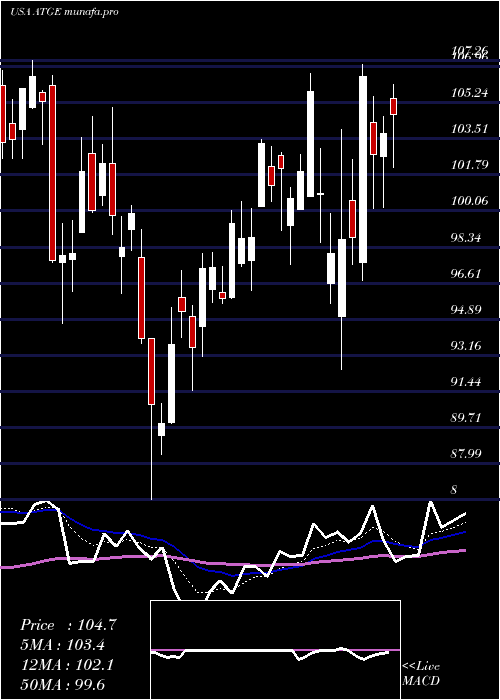
Daily price and charts and targets AdtalemGlobal Strong Daily Stock price targets for AdtalemGlobal ATGE are 91.63 and 93.76 | Daily Target 1 | 91.21 | | Daily Target 2 | 92.04 | | Daily Target 3 | 93.336666666667 | | Daily Target 4 | 94.17 | | Daily Target 5 | 95.47 |
Daily price and volume Adtalem Global
| Date |
Closing |
Open |
Range |
Volume |
Fri 12 December 2025 |
92.88 (-0.24%) |
93.87 |
92.50 - 94.63 |
0.8796 times |
Thu 11 December 2025 |
93.10 (0.09%) |
93.27 |
92.56 - 94.40 |
1.144 times |
Wed 10 December 2025 |
93.02 (-1.15%) |
93.67 |
92.68 - 94.87 |
0.9578 times |
Tue 09 December 2025 |
94.10 (0.58%) |
93.19 |
92.78 - 94.61 |
0.9623 times |
Mon 08 December 2025 |
93.56 (-1.04%) |
94.54 |
93.52 - 95.00 |
0.973 times |
Fri 05 December 2025 |
94.54 (-1.63%) |
96.02 |
92.80 - 96.90 |
1.0109 times |
Thu 04 December 2025 |
96.11 (1.87%) |
95.01 |
94.46 - 96.61 |
1.1339 times |
Wed 03 December 2025 |
94.35 (-0.01%) |
93.81 |
93.81 - 96.26 |
1.4467 times |
Tue 02 December 2025 |
94.36 (0.56%) |
94.25 |
93.96 - 95.91 |
0.5059 times |
Mon 01 December 2025 |
93.83 (1.37%) |
91.35 |
90.57 - 95.53 |
0.9858 times |
Fri 28 November 2025 |
92.56 (0.08%) |
92.43 |
92.18 - 93.71 |
0.4628 times |
Weekly price and charts AdtalemGlobal Strong weekly Stock price targets for AdtalemGlobal ATGE are 91.44 and 93.94 | Weekly Target 1 | 90.96 | | Weekly Target 2 | 91.92 | | Weekly Target 3 | 93.46 | | Weekly Target 4 | 94.42 | | Weekly Target 5 | 95.96 |
Weekly price and volumes for Adtalem Global
| Date |
Closing |
Open |
Range |
Volume |
Fri 12 December 2025 |
92.88 (-1.76%) |
94.54 |
92.50 - 95.00 |
0.9324 times |
Fri 05 December 2025 |
94.54 (2.14%) |
91.35 |
90.57 - 96.90 |
0.9639 times |
Fri 28 November 2025 |
92.56 (-0.87%) |
93.59 |
86.97 - 93.99 |
1.266 times |
Fri 21 November 2025 |
93.37 (-3.21%) |
96.44 |
91.94 - 96.96 |
0.9832 times |
Fri 14 November 2025 |
96.47 (1.67%) |
95.50 |
94.07 - 98.31 |
0.9717 times |
Fri 07 November 2025 |
94.89 (-3.19%) |
96.50 |
91.03 - 100.30 |
1.1131 times |
Fri 31 October 2025 |
98.02 (0%) |
130.57 |
94.29 - 135.99 |
1.2011 times |
Fri 31 October 2025 |
98.02 (-35.92%) |
153.08 |
94.29 - 154.91 |
1.7068 times |
Fri 24 October 2025 |
152.97 (1.08%) |
151.33 |
150.18 - 156.26 |
0.3661 times |
Fri 17 October 2025 |
151.33 (6.14%) |
142.54 |
142.47 - 152.65 |
0.4958 times |
Fri 10 October 2025 |
142.58 (-3.98%) |
149.22 |
141.64 - 151.36 |
0.4456 times |
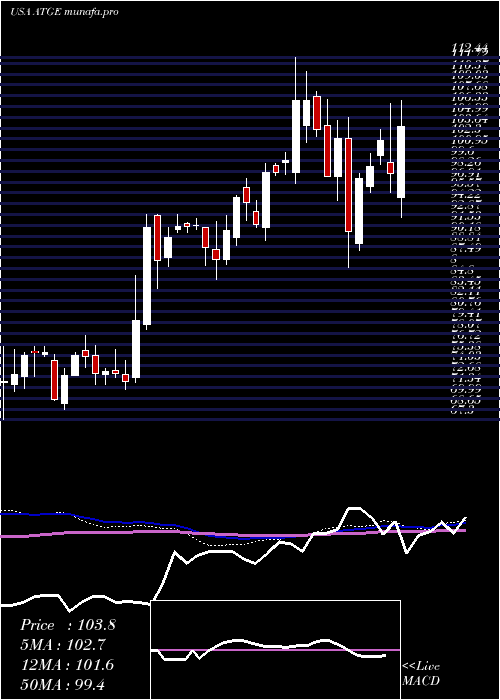
Monthly price and charts AdtalemGlobal Strong monthly Stock price targets for AdtalemGlobal ATGE are 91.73 and 98.06 | Monthly Target 1 | 87.12 | | Monthly Target 2 | 90 | | Monthly Target 3 | 93.45 | | Monthly Target 4 | 96.33 | | Monthly Target 5 | 99.78 |
Monthly price and volumes Adtalem Global
| Date |
Closing |
Open |
Range |
Volume |
Fri 12 December 2025 |
92.88 (0.35%) |
91.35 |
90.57 - 96.90 |
0.565 times |
Fri 28 November 2025 |
92.56 (-5.57%) |
96.50 |
86.97 - 100.30 |
1.2913 times |
Fri 31 October 2025 |
98.02 (-36.54%) |
152.10 |
94.29 - 156.26 |
1.3421 times |
Tue 30 September 2025 |
154.45 (17.95%) |
129.35 |
129.02 - 155.39 |
0.8113 times |
Fri 29 August 2025 |
130.95 (14.6%) |
114.70 |
113.07 - 137.51 |
0.9382 times |
Thu 31 July 2025 |
114.27 (-10.19%) |
126.61 |
111.53 - 127.36 |
0.8168 times |
Mon 30 June 2025 |
127.23 (-3.64%) |
131.40 |
117.11 - 134.49 |
0.8979 times |
Fri 30 May 2025 |
132.03 (24.32%) |
106.81 |
105.89 - 140.12 |
1.406 times |
Wed 30 April 2025 |
106.20 (5.52%) |
100.15 |
92.46 - 109.44 |
1.04 times |
Mon 31 March 2025 |
100.64 (-1.63%) |
102.33 |
86.26 - 105.00 |
0.8914 times |
Fri 28 February 2025 |
102.31 (-4.5%) |
104.02 |
94.68 - 110.67 |
0.8731 times |

DMA SMA EMA moving averages of Adtalem Global ATGE
DMA (daily moving average) of Adtalem Global ATGE
| DMA period | DMA value | | 5 day DMA | 93.33 | | 12 day DMA | 93.74 | | 20 day DMA | 93.64 | | 35 day DMA | 102.2 | | 50 day DMA | 116.13 | | 100 day DMA | 124.18 | | 150 day DMA | 124.47 | | 200 day DMA | 118.9 | EMA (exponential moving average) of Adtalem Global ATGE
| EMA period | EMA current | EMA prev | EMA prev2 | | 5 day EMA | 93.33 | 93.55 | 93.77 | | 12 day EMA | 93.97 | 94.17 | 94.36 | | 20 day EMA | 96.53 | 96.91 | 97.31 | | 35 day EMA | 106.49 | 107.29 | 108.13 | | 50 day EMA | 116.8 | 117.78 | 118.79 |
SMA (simple moving average) of Adtalem Global ATGE
| SMA period | SMA current | SMA prev | SMA prev2 | | 5 day SMA | 93.33 | 93.66 | 94.27 | | 12 day SMA | 93.74 | 93.47 | 93.16 | | 20 day SMA | 93.64 | 93.81 | 94 | | 35 day SMA | 102.2 | 103.92 | 105.61 | | 50 day SMA | 116.13 | 117.27 | 118.41 | | 100 day SMA | 124.18 | 124.39 | 124.61 | | 150 day SMA | 124.47 | 124.62 | 124.77 | | 200 day SMA | 118.9 | 118.92 | 118.95 |
|
|
