AnsysInc ANSS full analysis,charts,indicators,moving averages,SMA,DMA,EMA,ADX,MACD,RSIAnsys Inc ANSS WideScreen charts, DMA,SMA,EMA technical analysis, forecast prediction, by indicators ADX,MACD,RSI,CCI USA stock exchange
operates under Technology sector & deals in Computer Software Prepackaged Software
Daily price and charts and targets AnsysInc Strong Daily Stock price targets for AnsysInc ANSS are 363.95 and 384.65 | Daily Target 1 | 360.5 | | Daily Target 2 | 367.4 | | Daily Target 3 | 381.2 | | Daily Target 4 | 388.1 | | Daily Target 5 | 401.9 |
Daily price and volume Ansys Inc
| Date |
Closing |
Open |
Range |
Volume |
Wed 16 July 2025 |
374.30 (-4.69%) |
392.53 |
374.30 - 395.00 |
5.9697 times |
Tue 15 July 2025 |
392.72 (1.78%) |
386.52 |
385.63 - 393.20 |
0.934 times |
Mon 14 July 2025 |
385.85 (3.03%) |
394.05 |
383.15 - 395.48 |
1.4489 times |
Fri 11 July 2025 |
374.52 (0%) |
373.13 |
371.50 - 380.07 |
0.3446 times |
Thu 10 July 2025 |
374.52 (2.09%) |
366.01 |
364.75 - 374.78 |
0.3561 times |
Wed 09 July 2025 |
366.87 (-0.01%) |
366.90 |
364.72 - 369.25 |
0.1971 times |
Tue 08 July 2025 |
366.90 (1.05%) |
364.48 |
363.69 - 367.20 |
0.1631 times |
Mon 07 July 2025 |
363.09 (-1.19%) |
365.00 |
362.34 - 366.99 |
0.1559 times |
Thu 03 July 2025 |
367.48 (4.04%) |
367.77 |
362.11 - 368.00 |
0.2762 times |
Wed 02 July 2025 |
353.21 (0.02%) |
351.22 |
346.86 - 355.30 |
0.1543 times |
Tue 01 July 2025 |
353.14 (0.55%) |
349.13 |
348.80 - 354.02 |
0.2322 times |
Weekly price and charts AnsysInc Strong weekly Stock price targets for AnsysInc ANSS are 363.71 and 384.89 | Weekly Target 1 | 360.18 | | Weekly Target 2 | 367.24 | | Weekly Target 3 | 381.36 | | Weekly Target 4 | 388.42 | | Weekly Target 5 | 402.54 |
Weekly price and volumes for Ansys Inc
| Date |
Closing |
Open |
Range |
Volume |
Wed 16 July 2025 |
374.30 (-0.06%) |
394.05 |
374.30 - 395.48 |
4.5788 times |
Fri 11 July 2025 |
374.52 (1.92%) |
365.00 |
362.34 - 380.07 |
0.6671 times |
Thu 03 July 2025 |
367.48 (5.84%) |
350.00 |
346.86 - 368.00 |
0.4726 times |
Fri 27 June 2025 |
347.19 (3.65%) |
334.71 |
330.11 - 351.30 |
0.4057 times |
Fri 20 June 2025 |
334.96 (-0.9%) |
338.43 |
334.33 - 340.61 |
0.3972 times |
Fri 13 June 2025 |
338.01 (-0.37%) |
342.46 |
337.46 - 349.00 |
0.4619 times |
Fri 06 June 2025 |
339.27 (2.55%) |
328.85 |
325.51 - 342.75 |
0.6903 times |
Fri 30 May 2025 |
330.82 (-3.32%) |
345.81 |
321.60 - 349.07 |
1.2237 times |
Fri 23 May 2025 |
342.17 (-1.29%) |
341.53 |
339.41 - 347.28 |
0.4897 times |
Fri 16 May 2025 |
346.63 (3.86%) |
341.70 |
341.01 - 350.70 |
0.613 times |
Fri 09 May 2025 |
333.74 (1.51%) |
326.72 |
320.01 - 335.80 |
0.42 times |
Monthly price and charts AnsysInc Strong monthly Stock price targets for AnsysInc ANSS are 360.58 and 409.2 | Monthly Target 1 | 323.59 | | Monthly Target 2 | 348.95 | | Monthly Target 3 | 372.21333333333 | | Monthly Target 4 | 397.57 | | Monthly Target 5 | 420.83 |
Monthly price and volumes Ansys Inc
| Date |
Closing |
Open |
Range |
Volume |
Wed 16 July 2025 |
374.30 (6.57%) |
349.13 |
346.86 - 395.48 |
2.4616 times |
Mon 30 June 2025 |
351.22 (6.17%) |
328.85 |
325.51 - 352.57 |
0.906 times |
Fri 30 May 2025 |
330.82 (2.78%) |
307.72 |
307.72 - 350.70 |
1.3122 times |
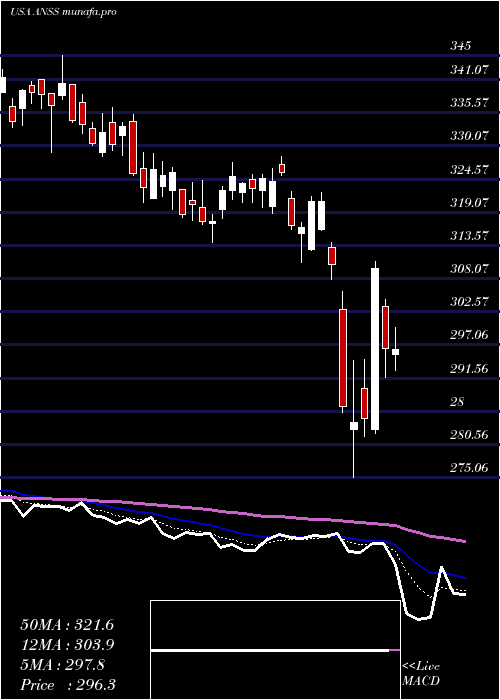
Wed 30 April 2025 |
321.88 (1.68%) |
312.83 |
275.06 - 322.36 |
1.0739 times |
Mon 31 March 2025 |
316.56 (-5.01%) |
334.05 |
310.78 - 335.23 |
0.7417 times |
Fri 28 February 2025 |
333.25 (-4.92%) |
350.49 |
328.34 - 350.49 |
0.7954 times |
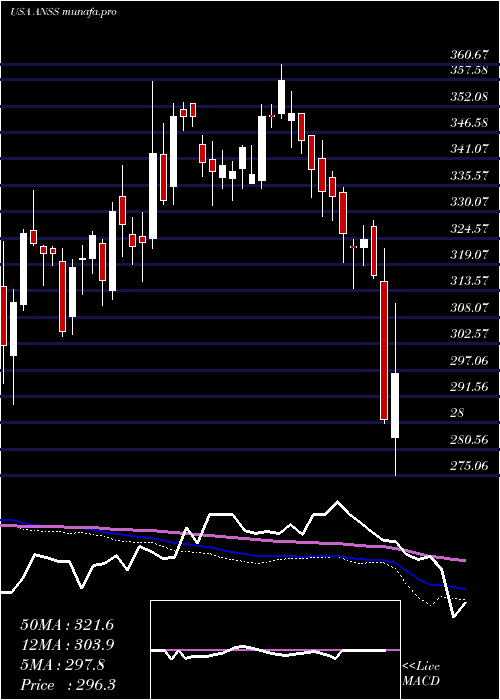
Fri 31 January 2025 |
350.50 (3.9%) |
339.37 |
332.42 - 360.67 |
0.8209 times |
Tue 31 December 2024 |
337.33 (-3.58%) |
344.19 |
331.47 - 346.00 |
0.4672 times |
Tue 26 November 2024 |
349.85 (9.19%) |
319.87 |
315.47 - 357.29 |
0.8215 times |
Thu 31 October 2024 |
320.41 (0.56%) |
318.00 |
310.61 - 339.62 |
0.5996 times |
Mon 30 September 2024 |
318.63 (-0.87%) |
319.78 |
304.07 - 325.99 |
0.5997 times |

DMA SMA EMA moving averages of Ansys Inc ANSS
DMA (daily moving average) of Ansys Inc ANSS
| DMA period | DMA value | | 5 day DMA | 380.38 | | 12 day DMA | 368.65 | | 20 day DMA | 356.87 | | 35 day DMA | 349 | | 50 day DMA | 345.86 | | 100 day DMA | 330.75 | | 150 day DMA | 334.82 | | 200 day DMA | 333.58 | EMA (exponential moving average) of Ansys Inc ANSS
| EMA period | EMA current | EMA prev | EMA prev2 | | 5 day EMA | 378.65 | 380.83 | 374.88 | | 12 day EMA | 369.83 | 369.02 | 364.71 | | 20 day EMA | 362.35 | 361.09 | 357.76 | | 35 day EMA | 353.92 | 352.72 | 350.37 | | 50 day EMA | 347.2 | 346.09 | 344.19 |
SMA (simple moving average) of Ansys Inc ANSS
| SMA period | SMA current | SMA prev | SMA prev2 | | 5 day SMA | 380.38 | 378.9 | 373.73 | | 12 day SMA | 368.65 | 366.39 | 362.28 | | 20 day SMA | 356.87 | 355.05 | 352.59 | | 35 day SMA | 349 | 348.13 | 346.71 | | 50 day SMA | 345.86 | 344.76 | 343.35 | | 100 day SMA | 330.75 | 330.37 | 329.83 | | 150 day SMA | 334.82 | 334.65 | 334.37 | | 200 day SMA | 333.58 | 333.28 | 332.9 |
|
|
