AdverumBiotechnologies ADVM full analysis,charts,indicators,moving averages,SMA,DMA,EMA,ADX,MACD,RSIAdverum Biotechnologies ADVM WideScreen charts, DMA,SMA,EMA technical analysis, forecast prediction, by indicators ADX,MACD,RSI,CCI USA stock exchange
operates under Health Care sector & deals in Biotechnology Biological Products No Diagnostic Substances
Daily price and charts and targets AdverumBiotechnologies Strong Daily Stock price targets for AdverumBiotechnologies ADVM are 4.29 and 4.66 | Daily Target 1 | 4.02 | | Daily Target 2 | 4.24 | | Daily Target 3 | 4.3866666666667 | | Daily Target 4 | 4.61 | | Daily Target 5 | 4.76 |
Daily price and volume Adverum Biotechnologies
| Date |
Closing |
Open |
Range |
Volume |
Tue 21 October 2025 |
4.47 (0.22%) |
4.47 |
4.16 - 4.53 |
0.4332 times |
Mon 20 October 2025 |
4.46 (2.06%) |
4.29 |
4.27 - 4.50 |
0.4259 times |
Fri 17 October 2025 |
4.37 (-5.41%) |
4.62 |
4.23 - 4.62 |
0.4393 times |
Thu 16 October 2025 |
4.62 (3.12%) |
4.65 |
4.43 - 4.81 |
0.6988 times |
Wed 15 October 2025 |
4.48 (-2.4%) |
4.60 |
4.25 - 4.65 |
0.8748 times |
Tue 14 October 2025 |
4.59 (10.34%) |
4.18 |
4.10 - 4.61 |
1.6356 times |
Mon 13 October 2025 |
4.16 (-13.51%) |
4.86 |
4.16 - 4.95 |
1.4038 times |
Fri 10 October 2025 |
4.81 (-9.59%) |
5.32 |
4.75 - 5.43 |
1.3326 times |
Thu 09 October 2025 |
5.32 (9.02%) |
4.87 |
4.85 - 5.59 |
1.9176 times |
Wed 08 October 2025 |
4.88 (-1.21%) |
4.93 |
4.72 - 4.97 |
0.8384 times |
Tue 07 October 2025 |
4.94 (-7.66%) |
5.27 |
4.80 - 5.35 |
1.5885 times |
Weekly price and charts AdverumBiotechnologies Strong weekly Stock price targets for AdverumBiotechnologies ADVM are 4.32 and 4.69 | Weekly Target 1 | 4.02 | | Weekly Target 2 | 4.24 | | Weekly Target 3 | 4.3866666666667 | | Weekly Target 4 | 4.61 | | Weekly Target 5 | 4.76 |
Weekly price and volumes for Adverum Biotechnologies
| Date |
Closing |
Open |
Range |
Volume |
Tue 21 October 2025 |
4.47 (2.29%) |
4.29 |
4.16 - 4.53 |
0.0989 times |
Fri 17 October 2025 |
4.37 (-9.15%) |
4.86 |
4.10 - 4.95 |
0.5818 times |
Fri 10 October 2025 |
4.81 (-12.39%) |
5.65 |
4.72 - 5.75 |
0.7689 times |
Fri 03 October 2025 |
5.49 (21.73%) |
4.69 |
4.34 - 5.75 |
1.129 times |
Fri 26 September 2025 |
4.51 (19.95%) |
4.05 |
3.25 - 5.19 |
6.2958 times |
Fri 19 September 2025 |
3.76 (24.5%) |
3.09 |
2.87 - 3.84 |
0.462 times |
Fri 12 September 2025 |
3.02 (-14.2%) |
3.52 |
2.95 - 3.59 |
0.2714 times |
Fri 05 September 2025 |
3.52 (14.29%) |
3.03 |
2.93 - 3.57 |
0.1765 times |
Fri 29 August 2025 |
3.08 (0%) |
3.05 |
2.97 - 3.14 |
0.0371 times |
Fri 29 August 2025 |
3.08 (3.7%) |
2.98 |
2.97 - 3.25 |
0.1785 times |
Fri 22 August 2025 |
2.97 (3.85%) |
2.90 |
2.71 - 3.05 |
0.2486 times |

Monthly price and charts AdverumBiotechnologies Strong monthly Stock price targets for AdverumBiotechnologies ADVM are 3.46 and 5.11 | Monthly Target 1 | 3.12 | | Monthly Target 2 | 3.8 | | Monthly Target 3 | 4.7733333333333 | | Monthly Target 4 | 5.45 | | Monthly Target 5 | 6.42 |
Monthly price and volumes Adverum Biotechnologies
| Date |
Closing |
Open |
Range |
Volume |
Tue 21 October 2025 |
4.47 (-1.32%) |
4.56 |
4.10 - 5.75 |
0.7019 times |
Tue 30 September 2025 |
4.53 (47.08%) |
3.03 |
2.87 - 5.19 |
2.3851 times |
Fri 29 August 2025 |
3.08 (28.87%) |
2.35 |
2.20 - 3.25 |
0.344 times |
Thu 31 July 2025 |
2.39 (11.16%) |
2.14 |
2.11 - 2.91 |
0.4797 times |
Mon 30 June 2025 |
2.15 (-3.15%) |
2.25 |
2.13 - 3.10 |
1.2181 times |
Fri 30 May 2025 |
2.22 (-31.9%) |
3.26 |
1.78 - 3.64 |
1.6362 times |
Wed 30 April 2025 |
3.26 (-25.4%) |
4.26 |
2.64 - 4.48 |
1.4067 times |
Mon 31 March 2025 |
4.37 (-7.22%) |
4.69 |
3.92 - 5.72 |
0.4696 times |
Fri 28 February 2025 |
4.71 (11.61%) |
4.01 |
3.52 - 4.93 |
0.6917 times |
Fri 31 January 2025 |
4.22 (-9.64%) |
4.75 |
4.01 - 5.11 |
0.6669 times |
Tue 31 December 2024 |
4.67 (-24.19%) |
5.92 |
4.42 - 6.12 |
0.6436 times |

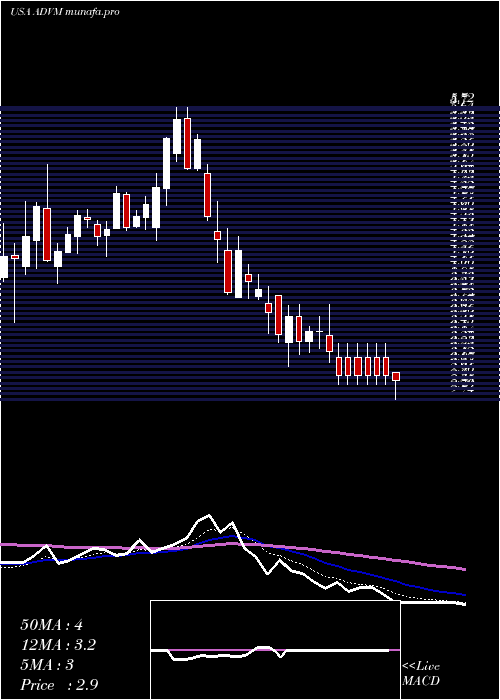
DMA SMA EMA moving averages of Adverum Biotechnologies ADVM
DMA (daily moving average) of Adverum Biotechnologies ADVM
| DMA period | DMA value | | 5 day DMA | 4.48 | | 12 day DMA | 4.7 | | 20 day DMA | 4.73 | | 35 day DMA | 4.12 | | 50 day DMA | 3.77 | | 100 day DMA | 3.13 | | 150 day DMA | 3.18 | | 200 day DMA | 3.48 | EMA (exponential moving average) of Adverum Biotechnologies ADVM
| EMA period | EMA current | EMA prev | EMA prev2 | | 5 day EMA | 4.5 | 4.51 | 4.53 | | 12 day EMA | 4.57 | 4.59 | 4.61 | | 20 day EMA | 4.47 | 4.47 | 4.47 | | 35 day EMA | 4.17 | 4.15 | 4.13 | | 50 day EMA | 3.73 | 3.7 | 3.67 |
SMA (simple moving average) of Adverum Biotechnologies ADVM
| SMA period | SMA current | SMA prev | SMA prev2 | | 5 day SMA | 4.48 | 4.5 | 4.44 | | 12 day SMA | 4.7 | 4.79 | 4.86 | | 20 day SMA | 4.73 | 4.71 | 4.66 | | 35 day SMA | 4.12 | 4.08 | 4.04 | | 50 day SMA | 3.77 | 3.73 | 3.68 | | 100 day SMA | 3.13 | 3.11 | 3.08 | | 150 day SMA | 3.18 | 3.18 | 3.18 | | 200 day SMA | 3.48 | 3.48 | 3.49 |
|
|
