WatscoInc WSO.B full analysis,charts,indicators,moving averages,SMA,DMA,EMA,ADX,MACD,RSIWatsco Inc WSO.B WideScreen charts, DMA,SMA,EMA technical analysis, forecast prediction, by indicators ADX,MACD,RSI,CCI NYSE stock exchange
operates under N A sector & deals in N A
Daily price and charts and targets WatscoInc Strong Daily Stock price targets for WatscoInc WSO.B are 345.38 and 345.38 | Daily Target 1 | 345.38 | | Daily Target 2 | 345.38 | | Daily Target 3 | 345.38 | | Daily Target 4 | 345.38 | | Daily Target 5 | 345.38 |
Daily price and volume Watsco Inc
| Date |
Closing |
Open |
Range |
Volume |
Wed 03 December 2025 |
345.38 (-1.74%) |
345.38 |
345.38 - 345.38 |
0.5 times |
Mon 10 November 2025 |
351.50 (-4%) |
351.50 |
351.50 - 351.50 |
0.5 times |
Wed 05 November 2025 |
366.13 (-0.01%) |
366.13 |
366.13 - 366.13 |
0.5 times |
Thu 30 October 2025 |
366.15 (-3.48%) |
366.15 |
366.15 - 366.15 |
1.5 times |
Mon 20 October 2025 |
379.35 (-5.77%) |
379.35 |
379.35 - 379.35 |
2 times |
Tue 09 September 2025 |
402.56 (-7.98%) |
402.56 |
402.56 - 402.56 |
0.5 times |
Fri 27 June 2025 |
437.48 (-2.78%) |
437.48 |
437.48 - 437.48 |
1 times |
Thu 29 May 2025 |
450.00 (-4.56%) |
450.00 |
450.00 - 450.00 |
0.5 times |
Thu 08 May 2025 |
471.49 (-0.54%) |
471.03 |
471.03 - 471.49 |
2.5 times |
Tue 06 May 2025 |
474.05 (6%) |
474.05 |
474.05 - 474.05 |
0.5 times |
Wed 30 April 2025 |
447.21 (-11.81%) |
447.21 |
447.21 - 447.21 |
4.5 times |
Weekly price and charts WatscoInc Strong weekly Stock price targets for WatscoInc WSO.B are 342.32 and 348.44 | Weekly Target 1 | 341.3 | | Weekly Target 2 | 343.34 | | Weekly Target 3 | 347.42 | | Weekly Target 4 | 349.46 | | Weekly Target 5 | 353.54 |
Weekly price and volumes for Watsco Inc
| Date |
Closing |
Open |
Range |
Volume |
Wed 03 December 2025 |
345.38 (-5.67%) |
351.50 |
345.38 - 351.50 |
0.3788 times |
Wed 05 November 2025 |
366.13 (-0.01%) |
366.13 |
366.13 - 366.13 |
0.1894 times |
Thu 30 October 2025 |
366.15 (-9.04%) |
379.35 |
366.15 - 379.35 |
1.3258 times |
Tue 09 September 2025 |
402.56 (-7.98%) |
402.56 |
402.56 - 402.56 |
0.1894 times |
Fri 27 June 2025 |
437.48 (-7.21%) |
450.00 |
437.48 - 450.00 |
0.5682 times |
Thu 08 May 2025 |
471.49 (5.43%) |
474.05 |
471.03 - 474.05 |
1.1364 times |
Wed 30 April 2025 |
447.21 (-11.22%) |
507.10 |
447.21 - 507.10 |
1.8939 times |
Tue 11 March 2025 |
503.71 (0.37%) |
503.71 |
503.71 - 503.71 |
0.3788 times |
Wed 05 March 2025 |
501.84 (0.1%) |
492.95 |
492.95 - 502.15 |
2.9924 times |
Mon 24 February 2025 |
501.35 (-2.06%) |
501.35 |
501.35 - 501.35 |
0.947 times |
Wed 19 February 2025 |
511.89 (5.81%) |
529.46 |
511.89 - 529.46 |
1.7045 times |

Monthly price and charts WatscoInc Strong monthly Stock price targets for WatscoInc WSO.B are 345.38 and 345.38 | Monthly Target 1 | 345.38 | | Monthly Target 2 | 345.38 | | Monthly Target 3 | 345.38 | | Monthly Target 4 | 345.38 | | Monthly Target 5 | 345.38 |
Monthly price and volumes Watsco Inc
| Date |
Closing |
Open |
Range |
Volume |
Wed 03 December 2025 |
345.38 (-1.74%) |
345.38 |
345.38 - 345.38 |
0.0782 times |
Mon 10 November 2025 |
351.50 (-4%) |
366.13 |
351.50 - 366.13 |
0.1565 times |
Thu 30 October 2025 |
366.15 (-9.04%) |
379.35 |
366.15 - 379.35 |
0.5477 times |
Tue 09 September 2025 |
402.56 (-7.98%) |
402.56 |
402.56 - 402.56 |
0.0782 times |
Fri 27 June 2025 |
437.48 (-2.78%) |
437.48 |
437.48 - 437.48 |
0.1565 times |
Thu 29 May 2025 |
450.00 (0.62%) |
474.05 |
450.00 - 474.05 |
0.5477 times |
Wed 30 April 2025 |
447.21 (-11.81%) |
447.21 |
447.21 - 447.21 |
0.7042 times |
Mon 17 March 2025 |
507.10 (1.15%) |
492.95 |
492.95 - 507.10 |
1.471 times |
Mon 24 February 2025 |
501.35 (3.53%) |
482.83 |
464.07 - 529.46 |
5.2426 times |
Fri 31 January 2025 |
484.25 (-9.49%) |
475.15 |
469.95 - 484.25 |
1.0172 times |
Thu 21 November 2024 |
535.00 (13.61%) |
518.97 |
518.97 - 535.00 |
1.252 times |

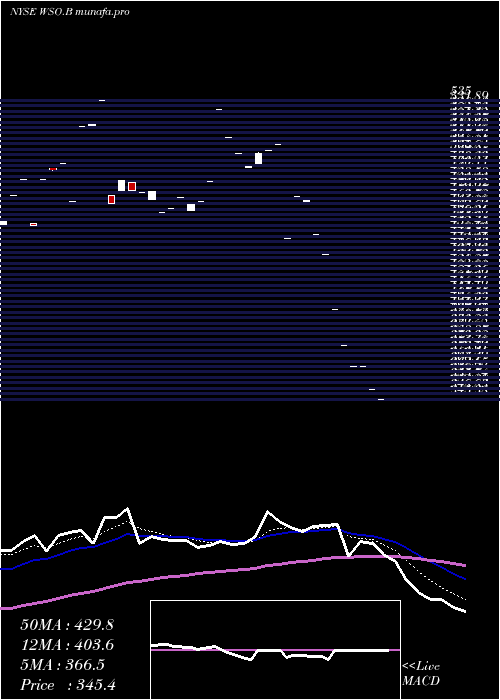
DMA SMA EMA moving averages of Watsco Inc WSO.B
DMA (daily moving average) of Watsco Inc WSO.B
| DMA period | DMA value | | 5 day DMA | 361.7 | | 12 day DMA | 416.53 | | 20 day DMA | 449.71 | | 35 day DMA | 465.27 | | 50 day DMA | 456.96 | | 100 day DMA | 374.49 | | 150 day DMA | 344.37 | | 200 day DMA | 321.06 | EMA (exponential moving average) of Watsco Inc WSO.B
| EMA period | EMA current | EMA prev | EMA prev2 | | 5 day EMA | 366.51 | 377.08 | 389.87 | | 12 day EMA | 403.57 | 414.15 | 425.54 | | 20 day EMA | 425.48 | 433.91 | 442.58 | | 35 day EMA | 437.15 | 442.55 | 447.91 | | 50 day EMA | 439.92 | 443.78 | 447.55 |
SMA (simple moving average) of Watsco Inc WSO.B
| SMA period | SMA current | SMA prev | SMA prev2 | | 5 day SMA | 361.7 | 373.14 | 390.33 | | 12 day SMA | 416.53 | 429.73 | 442.26 | | 20 day SMA | 449.71 | 455.88 | 462 | | 35 day SMA | 465.27 | 469.26 | 472.24 | | 50 day SMA | 456.96 | 457.33 | 457.64 | | 100 day SMA | 374.49 | 373.63 | 372.7 | | 150 day SMA | 344.37 | 343.77 | 343.13 | | 200 day SMA | 321.06 | 320.56 | 320.02 |
|
|
