SouthwesternEnergy SWN full analysis,charts,indicators,moving averages,SMA,DMA,EMA,ADX,MACD,RSISouthwestern Energy SWN WideScreen charts, DMA,SMA,EMA technical analysis, forecast prediction, by indicators ADX,MACD,RSI,CCI NYSE stock exchange
operates under Energy sector & deals in Oil Gas Production
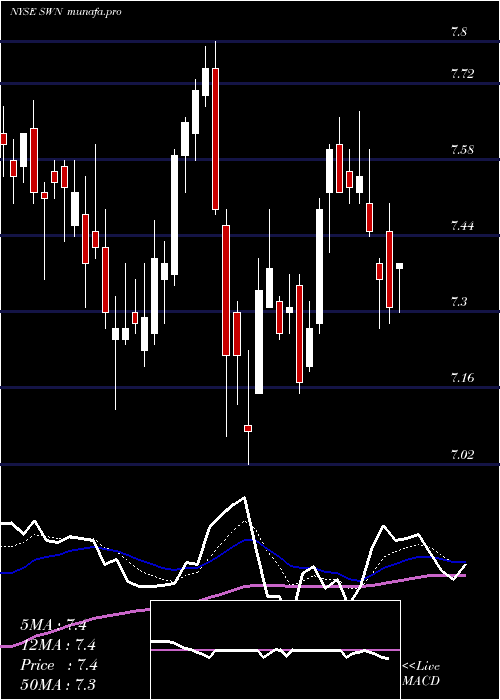
Daily price and charts and targets SouthwesternEnergy Strong Daily Stock price targets for SouthwesternEnergy SWN are 7.02 and 7.19 | Daily Target 1 | 6.98 | | Daily Target 2 | 7.05 | | Daily Target 3 | 7.1533333333333 | | Daily Target 4 | 7.22 | | Daily Target 5 | 7.32 |
Daily price and volume Southwestern Energy
| Date |
Closing |
Open |
Range |
Volume |
| Mon 30 September 2024 |
7.11 (-0.56%) |
7.12 |
7.09 - 7.26 |
3.2354 times |
| Fri 27 September 2024 |
7.15 (2.44%) |
7.01 |
6.99 - 7.26 |
0.8881 times |
| Thu 26 September 2024 |
6.98 (3.71%) |
6.75 |
6.71 - 7.01 |
1.0864 times |
| Wed 25 September 2024 |
6.73 (-1.9%) |
6.87 |
6.72 - 6.90 |
0.5477 times |
| Tue 24 September 2024 |
6.86 (-0.29%) |
6.95 |
6.85 - 6.96 |
0.4981 times |
| Mon 23 September 2024 |
6.88 (2.38%) |
6.73 |
6.71 - 6.93 |
0.7294 times |
| Fri 20 September 2024 |
6.72 (2.44%) |
6.59 |
6.53 - 6.77 |
1.1052 times |
| Thu 19 September 2024 |
6.56 (3.31%) |
6.50 |
6.42 - 6.63 |
0.6817 times |
| Wed 18 September 2024 |
6.35 (0.95%) |
6.30 |
6.27 - 6.48 |
0.7961 times |
| Tue 17 September 2024 |
6.29 (0.48%) |
6.26 |
6.22 - 6.30 |
0.4319 times |
| Mon 16 September 2024 |
6.26 (0%) |
6.27 |
6.24 - 6.35 |
0.3562 times |
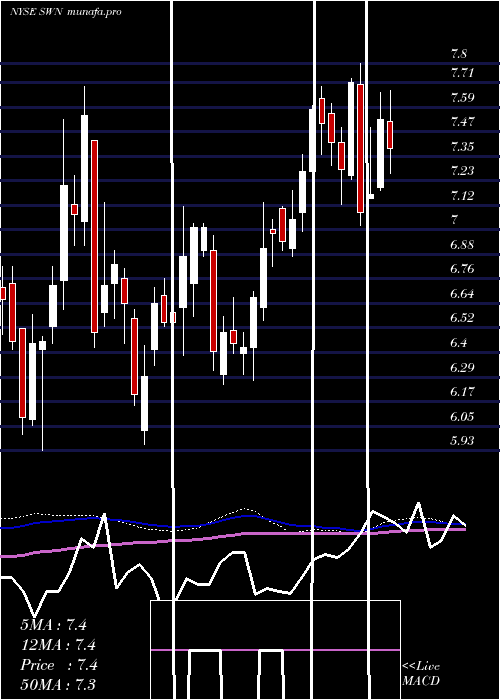
Weekly price and charts SouthwesternEnergy Strong weekly Stock price targets for SouthwesternEnergy SWN are 7.02 and 7.19 | Weekly Target 1 | 6.98 | | Weekly Target 2 | 7.05 | | Weekly Target 3 | 7.1533333333333 | | Weekly Target 4 | 7.22 | | Weekly Target 5 | 7.32 |
Weekly price and volumes for Southwestern Energy
| Date |
Closing |
Open |
Range |
Volume |
| Mon 30 September 2024 |
7.11 (-0.56%) |
7.12 |
7.09 - 7.26 |
1.3599 times |
| Fri 27 September 2024 |
7.15 (6.4%) |
6.73 |
6.71 - 7.26 |
1.576 times |
| Fri 20 September 2024 |
6.72 (7.35%) |
6.27 |
6.22 - 6.77 |
1.4169 times |
| Fri 13 September 2024 |
6.26 (3.64%) |
5.97 |
5.89 - 6.28 |
0.9698 times |
| Fri 06 September 2024 |
6.04 (-5.33%) |
6.26 |
5.98 - 6.29 |
1.1461 times |
| Fri 30 August 2024 |
6.38 (0%) |
6.31 |
6.28 - 6.41 |
0.1788 times |
| Fri 30 August 2024 |
6.38 (1.43%) |
6.32 |
6.08 - 6.44 |
0.7004 times |
| Fri 23 August 2024 |
6.29 (0.8%) |
6.27 |
6.13 - 6.40 |
0.7328 times |
| Fri 16 August 2024 |
6.24 (1.13%) |
6.20 |
6.10 - 6.30 |
0.7149 times |
| Fri 09 August 2024 |
6.17 (1.15%) |
5.92 |
5.85 - 6.24 |
1.2044 times |
| Fri 02 August 2024 |
6.10 (-6.58%) |
6.50 |
6.01 - 6.53 |
1.7962 times |
Monthly price and charts SouthwesternEnergy Strong monthly Stock price targets for SouthwesternEnergy SWN are 6.5 and 7.87 | Monthly Target 1 | 5.38 | | Monthly Target 2 | 6.25 | | Monthly Target 3 | 6.7533333333333 | | Monthly Target 4 | 7.62 | | Monthly Target 5 | 8.12 |
Monthly price and volumes Southwestern Energy
| Date |
Closing |
Open |
Range |
Volume |
| Mon 30 September 2024 |
7.11 (11.44%) |
6.26 |
5.89 - 7.26 |
1.4937 times |
| Fri 30 August 2024 |
6.38 (-1.09%) |
6.48 |
5.85 - 6.52 |
1.0093 times |
| Wed 31 July 2024 |
6.45 (-4.16%) |
6.75 |
6.26 - 7.04 |
1.3036 times |
| Fri 28 June 2024 |
6.73 (-10.62%) |
7.61 |
6.65 - 7.63 |
0.7594 times |
| Fri 31 May 2024 |
7.53 (0.53%) |
7.46 |
7.02 - 7.67 |
0.7747 times |
| Tue 30 April 2024 |
7.49 (-1.19%) |
7.63 |
7.12 - 7.80 |
0.7247 times |
| Thu 28 March 2024 |
7.58 (8.75%) |
6.99 |
6.87 - 7.60 |
0.7532 times |
| Thu 29 February 2024 |
6.97 (8.06%) |
6.48 |
6.27 - 7.13 |
0.7802 times |
| Wed 31 January 2024 |
6.45 (-1.53%) |
6.62 |
6.25 - 7.11 |
1.529 times |
| Fri 29 December 2023 |
6.55 (-0.61%) |
6.55 |
5.96 - 6.76 |
0.8722 times |
| Thu 30 November 2023 |
6.59 (-7.57%) |
7.09 |
6.43 - 7.69 |
1.0709 times |

DMA SMA EMA moving averages of Southwestern Energy SWN
DMA (daily moving average) of Southwestern Energy SWN
| DMA period | DMA value | | 5 day DMA | 6.97 | | 12 day DMA | 6.68 | | 20 day DMA | 6.45 | | 35 day DMA | 6.37 | | 50 day DMA | 6.34 | | 100 day DMA | 6.7 | | 150 day DMA | 6.91 | | 200 day DMA | 6.83 | EMA (exponential moving average) of Southwestern Energy SWN
| EMA period | EMA current | EMA prev | EMA prev2 | | 5 day EMA | 6.98 | 6.92 | 6.8 | | 12 day EMA | 6.75 | 6.68 | 6.6 | | 20 day EMA | 6.6 | 6.55 | 6.49 | | 35 day EMA | 6.5 | 6.46 | 6.42 | | 50 day EMA | 6.44 | 6.41 | 6.38 |
SMA (simple moving average) of Southwestern Energy SWN
| SMA period | SMA current | SMA prev | SMA prev2 | | 5 day SMA | 6.97 | 6.92 | 6.83 | | 12 day SMA | 6.68 | 6.6 | 6.52 | | 20 day SMA | 6.45 | 6.41 | 6.37 | | 35 day SMA | 6.37 | 6.34 | 6.32 | | 50 day SMA | 6.34 | 6.34 | 6.33 | | 100 day SMA | 6.7 | 6.7 | 6.71 | | 150 day SMA | 6.91 | 6.91 | 6.9 | | 200 day SMA | 6.83 | 6.83 | 6.83 |
|
|
