QuestarCorp STR full analysis,charts,indicators,moving averages,SMA,DMA,EMA,ADX,MACD,RSIQuestar Corp STR WideScreen charts, DMA,SMA,EMA technical analysis, forecast prediction, by indicators ADX,MACD,RSI,CCI NYSE stock exchange
Daily price and charts and targets QuestarCorp Strong Daily Stock price targets for QuestarCorp STR are 17.86 and 18.3 | Daily Target 1 | 17.77 | | Daily Target 2 | 17.95 | | Daily Target 3 | 18.213333333333 | | Daily Target 4 | 18.39 | | Daily Target 5 | 18.65 |
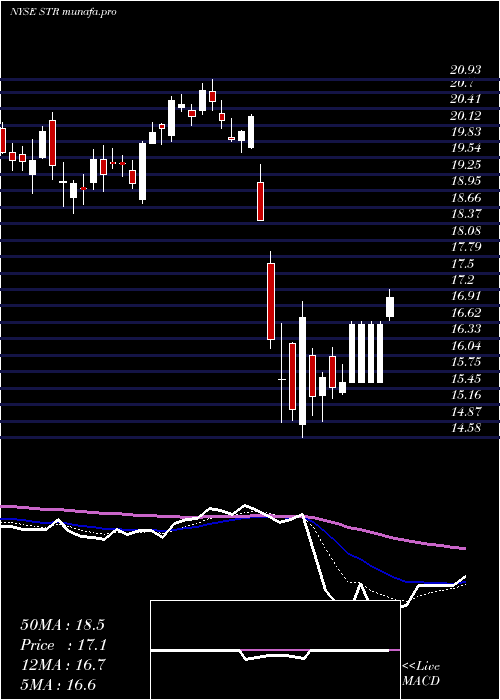
Daily price and volume Questar Corp
| Date |
Closing |
Open |
Range |
Volume |
Mon 18 August 2025 |
18.12 (-0.98%) |
18.27 |
18.04 - 18.48 |
5.2347 times |
Fri 15 August 2025 |
18.30 (-1.88%) |
18.60 |
18.26 - 18.61 |
0.4759 times |
Thu 14 August 2025 |
18.65 (-0.96%) |
18.46 |
18.26 - 18.71 |
0.4537 times |
Wed 13 August 2025 |
18.83 (1.02%) |
18.54 |
18.49 - 18.89 |
0.33 times |
Tue 12 August 2025 |
18.64 (2.59%) |
18.24 |
18.21 - 18.67 |
0.6466 times |
Mon 11 August 2025 |
18.17 (-1.41%) |
18.43 |
17.98 - 18.58 |
0.3278 times |
Fri 08 August 2025 |
18.43 (0.27%) |
18.42 |
18.31 - 18.71 |
0.3566 times |
Thu 07 August 2025 |
18.38 (-1.18%) |
18.72 |
18.34 - 19.04 |
0.569 times |
Wed 06 August 2025 |
18.60 (1.81%) |
18.16 |
18.14 - 19.05 |
0.8285 times |
Tue 05 August 2025 |
18.27 (3.57%) |
18.10 |
17.94 - 18.51 |
0.7772 times |
Fri 01 August 2025 |
17.64 (-2.92%) |
18.07 |
17.41 - 18.16 |
0.2827 times |
Weekly price and charts QuestarCorp Strong weekly Stock price targets for QuestarCorp STR are 17.86 and 18.3 | Weekly Target 1 | 17.77 | | Weekly Target 2 | 17.95 | | Weekly Target 3 | 18.213333333333 | | Weekly Target 4 | 18.39 | | Weekly Target 5 | 18.65 |
Weekly price and volumes for Questar Corp
| Date |
Closing |
Open |
Range |
Volume |
Mon 18 August 2025 |
18.12 (-0.98%) |
18.27 |
18.04 - 18.48 |
2.445 times |
Fri 15 August 2025 |
18.30 (-0.71%) |
18.43 |
17.98 - 18.89 |
1.0435 times |
Fri 08 August 2025 |
18.43 (4.48%) |
18.10 |
17.94 - 19.05 |
1.1824 times |
Fri 01 August 2025 |
17.64 (-3.97%) |
18.52 |
17.41 - 18.68 |
0.53 times |
Fri 25 July 2025 |
18.37 (-1.76%) |
18.64 |
17.97 - 18.72 |
0.4557 times |
Fri 18 July 2025 |
18.70 (0.59%) |
18.50 |
17.56 - 18.84 |
0.7444 times |
Fri 11 July 2025 |
18.59 (0.98%) |
18.20 |
17.41 - 18.77 |
1.3085 times |
Thu 03 July 2025 |
18.41 (-0.16%) |
18.48 |
18.12 - 18.75 |
0.7997 times |
Fri 27 June 2025 |
18.44 (-6.06%) |
19.86 |
18.37 - 19.94 |
0.9089 times |
Fri 20 June 2025 |
19.63 (-4.2%) |
20.15 |
19.58 - 20.42 |
0.5819 times |
Fri 13 June 2025 |
20.49 (2.71%) |
19.66 |
19.66 - 20.78 |
1.5242 times |

Monthly price and charts QuestarCorp Strong monthly Stock price targets for QuestarCorp STR are 17.77 and 19.41 | Monthly Target 1 | 16.55 | | Monthly Target 2 | 17.34 | | Monthly Target 3 | 18.193333333333 | | Monthly Target 4 | 18.98 | | Monthly Target 5 | 19.83 |
Monthly price and volumes Questar Corp
| Date |
Closing |
Open |
Range |
Volume |
Mon 18 August 2025 |
18.12 (-0.28%) |
18.07 |
17.41 - 19.05 |
1.5676 times |
Thu 31 July 2025 |
18.17 (-1.14%) |
18.53 |
17.41 - 18.84 |
1.1196 times |
Mon 30 June 2025 |
18.38 (7.67%) |
17.46 |
17.20 - 20.78 |
2.0852 times |
Fri 30 May 2025 |
17.07 (0.65%) |
16.97 |
16.70 - 19.03 |
0.6524 times |
Wed 30 April 2025 |
16.96 (-14.65%) |
19.85 |
14.58 - 20.30 |
0.8578 times |
Mon 31 March 2025 |
19.87 (-0.65%) |
20.20 |
18.55 - 20.93 |
0.8015 times |
Fri 28 February 2025 |
20.00 (-0.7%) |
20.11 |
18.90 - 20.58 |
0.5985 times |
Fri 31 January 2025 |
20.14 (5.01%) |
19.42 |
19.37 - 22.18 |
0.6941 times |
Tue 31 December 2024 |
19.18 (-18.93%) |
23.06 |
18.40 - 23.06 |
0.7092 times |
Tue 26 November 2024 |
23.66 (6.15%) |
22.47 |
21.98 - 25.52 |
0.914 times |
Thu 31 October 2024 |
22.29 (6.96%) |
20.80 |
20.66 - 23.75 |
0.7884 times |

DMA SMA EMA moving averages of Questar Corp STR
DMA (daily moving average) of Questar Corp STR
| DMA period | DMA value | | 5 day DMA | 18.51 | | 12 day DMA | 18.35 | | 20 day DMA | 18.33 | | 35 day DMA | 18.29 | | 50 day DMA | 18.66 | | 100 day DMA | 18.1 | | 150 day DMA | 18.82 | | 200 day DMA | 19.6 | EMA (exponential moving average) of Questar Corp STR
| EMA period | EMA current | EMA prev | EMA prev2 | | 5 day EMA | 18.37 | 18.49 | 18.58 | | 12 day EMA | 18.38 | 18.43 | 18.45 | | 20 day EMA | 18.37 | 18.4 | 18.41 | | 35 day EMA | 18.48 | 18.5 | 18.51 | | 50 day EMA | 18.57 | 18.59 | 18.6 |
SMA (simple moving average) of Questar Corp STR
| SMA period | SMA current | SMA prev | SMA prev2 | | 5 day SMA | 18.51 | 18.52 | 18.54 | | 12 day SMA | 18.35 | 18.35 | 18.36 | | 20 day SMA | 18.33 | 18.36 | 18.36 | | 35 day SMA | 18.29 | 18.3 | 18.3 | | 50 day SMA | 18.66 | 18.7 | 18.68 | | 100 day SMA | 18.1 | 18.12 | 18.14 | | 150 day SMA | 18.82 | 18.84 | 18.85 | | 200 day SMA | 19.6 | 19.62 | 19.64 |
|
|
