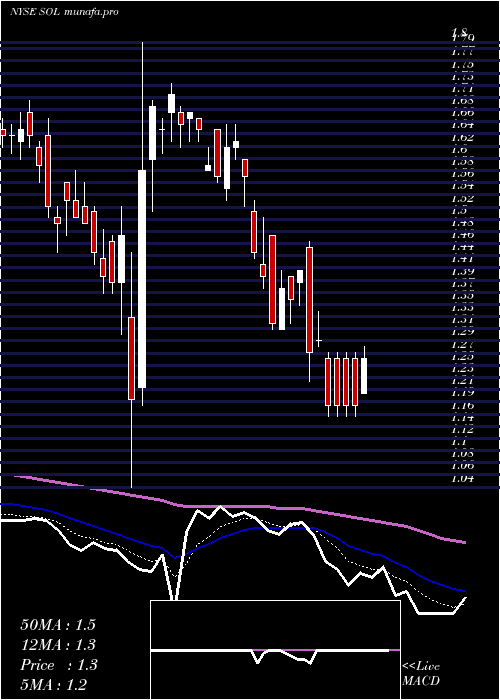
Renesola SOL full analysis,charts,indicators,moving averages,SMA,DMA,EMA,ADX,MACD,RSIRenesola SOL WideScreen charts, DMA,SMA,EMA technical analysis, forecast prediction, by indicators ADX,MACD,RSI,CCI NYSE stock exchange
operates under Technology sector & deals in Semiconductors
Daily price and charts and targets Renesola Strong Daily Stock price targets for Renesola SOL are 1.84 and 1.98 | Daily Target 1 | 1.73 | | Daily Target 2 | 1.81 | | Daily Target 3 | 1.87 | | Daily Target 4 | 1.95 | | Daily Target 5 | 2.01 |
Daily price and volume Renesola
| Date |
Closing |
Open |
Range |
Volume |
Tue 09 December 2025 |
1.89 (5.59%) |
1.79 |
1.79 - 1.93 |
2.7336 times |
Mon 08 December 2025 |
1.79 (-0.56%) |
1.84 |
1.78 - 1.84 |
0.6862 times |
Fri 05 December 2025 |
1.80 (2.86%) |
1.75 |
1.75 - 1.82 |
1.1721 times |
Thu 04 December 2025 |
1.75 (1.16%) |
1.76 |
1.73 - 1.76 |
0.3734 times |
Wed 03 December 2025 |
1.73 (1.76%) |
1.69 |
1.69 - 1.76 |
0.6878 times |
Tue 02 December 2025 |
1.70 (-0.58%) |
1.71 |
1.66 - 1.73 |
1.242 times |
Mon 01 December 2025 |
1.71 (-1.16%) |
1.70 |
1.70 - 1.73 |
0.743 times |
Fri 28 November 2025 |
1.73 (-1.14%) |
1.79 |
1.71 - 1.79 |
1.1456 times |
Wed 26 November 2025 |
1.75 (-1.69%) |
1.78 |
1.75 - 1.79 |
0.7743 times |
Tue 25 November 2025 |
1.78 (0%) |
1.78 |
1.77 - 1.79 |
0.442 times |
Mon 24 November 2025 |
1.78 (-0.56%) |
1.79 |
1.78 - 1.82 |
0.4518 times |
Weekly price and charts Renesola Strong weekly Stock price targets for Renesola SOL are 1.84 and 1.99 | Weekly Target 1 | 1.72 | | Weekly Target 2 | 1.8 | | Weekly Target 3 | 1.8666666666667 | | Weekly Target 4 | 1.95 | | Weekly Target 5 | 2.02 |
Weekly price and volumes for Renesola
| Date |
Closing |
Open |
Range |
Volume |
Tue 09 December 2025 |
1.89 (5%) |
1.84 |
1.78 - 1.93 |
1.1151 times |
Fri 05 December 2025 |
1.80 (4.05%) |
1.70 |
1.66 - 1.82 |
1.3755 times |
Fri 28 November 2025 |
1.73 (-3.35%) |
1.79 |
1.71 - 1.82 |
0.9175 times |
Fri 21 November 2025 |
1.79 (-3.76%) |
1.86 |
1.76 - 1.88 |
1.2759 times |
Fri 14 November 2025 |
1.86 (-1.59%) |
1.89 |
1.81 - 1.90 |
0.7201 times |
Fri 07 November 2025 |
1.89 (1.61%) |
1.87 |
1.84 - 1.90 |
0.9373 times |
Fri 31 October 2025 |
1.86 (0%) |
1.83 |
1.83 - 1.87 |
0.1436 times |
Fri 31 October 2025 |
1.86 (0%) |
1.85 |
1.82 - 1.87 |
0.9712 times |
Fri 24 October 2025 |
1.86 (2.2%) |
1.82 |
1.82 - 1.87 |
0.9722 times |
Fri 17 October 2025 |
1.82 (-3.7%) |
1.85 |
1.81 - 1.87 |
1.5717 times |
Tue 07 October 2025 |
1.89 (2.16%) |
1.87 |
1.85 - 1.92 |
1.0442 times |

Monthly price and charts Renesola Strong monthly Stock price targets for Renesola SOL are 1.78 and 2.05 | Monthly Target 1 | 1.56 | | Monthly Target 2 | 1.72 | | Monthly Target 3 | 1.8266666666667 | | Monthly Target 4 | 1.99 | | Monthly Target 5 | 2.1 |
Monthly price and volumes Renesola
| Date |
Closing |
Open |
Range |
Volume |
Tue 09 December 2025 |
1.89 (9.25%) |
1.70 |
1.66 - 1.93 |
0.389 times |
Fri 28 November 2025 |
1.73 (-6.99%) |
1.87 |
1.71 - 1.90 |
0.6015 times |
Fri 31 October 2025 |
1.86 (-1.59%) |
1.89 |
1.81 - 1.92 |
0.8186 times |
Tue 30 September 2025 |
1.89 (3.85%) |
1.83 |
1.83 - 1.91 |
0.6511 times |
Fri 29 August 2025 |
1.82 (-2.67%) |
1.82 |
1.81 - 1.91 |
0.6556 times |
Thu 31 July 2025 |
1.87 (0%) |
1.87 |
1.87 - 1.95 |
1.1217 times |
Mon 30 June 2025 |
1.87 (4.47%) |
1.78 |
1.64 - 1.91 |
1.3789 times |
Fri 30 May 2025 |
1.79 (32.59%) |
1.30 |
1.30 - 1.87 |
0.6639 times |
Wed 30 April 2025 |
1.35 (-14.01%) |
1.55 |
1.16 - 1.66 |
0.8466 times |
Mon 31 March 2025 |
1.57 (-1.26%) |
1.64 |
1.04 - 1.80 |
2.8731 times |
Fri 28 February 2025 |
1.59 (-14.97%) |
1.82 |
1.56 - 1.88 |
0.7047 times |

DMA SMA EMA moving averages of Renesola SOL
DMA (daily moving average) of Renesola SOL
| DMA period | DMA value | | 5 day DMA | 1.79 | | 12 day DMA | 1.77 | | 20 day DMA | 1.8 | | 35 day DMA | 1.82 | | 50 day DMA | 1.84 | | 100 day DMA | 1.86 | | 150 day DMA | 1.81 | | 200 day DMA | 1.72 | EMA (exponential moving average) of Renesola SOL
| EMA period | EMA current | EMA prev | EMA prev2 | | 5 day EMA | 1.81 | 1.77 | 1.76 | | 12 day EMA | 1.79 | 1.77 | 1.77 | | 20 day EMA | 1.79 | 1.78 | 1.78 | | 35 day EMA | 1.81 | 1.81 | 1.81 | | 50 day EMA | 1.85 | 1.85 | 1.85 |
SMA (simple moving average) of Renesola SOL
| SMA period | SMA current | SMA prev | SMA prev2 | | 5 day SMA | 1.79 | 1.75 | 1.74 | | 12 day SMA | 1.77 | 1.76 | 1.76 | | 20 day SMA | 1.8 | 1.8 | 1.8 | | 35 day SMA | 1.82 | 1.82 | 1.82 | | 50 day SMA | 1.84 | 1.84 | 1.84 | | 100 day SMA | 1.86 | 1.86 | 1.86 | | 150 day SMA | 1.81 | 1.81 | 1.8 | | 200 day SMA | 1.72 | 1.72 | 1.72 |
|
|
