SandstormGold SAND full analysis,charts,indicators,moving averages,SMA,DMA,EMA,ADX,MACD,RSISandstorm Gold SAND WideScreen charts, DMA,SMA,EMA technical analysis, forecast prediction, by indicators ADX,MACD,RSI,CCI NYSE stock exchange
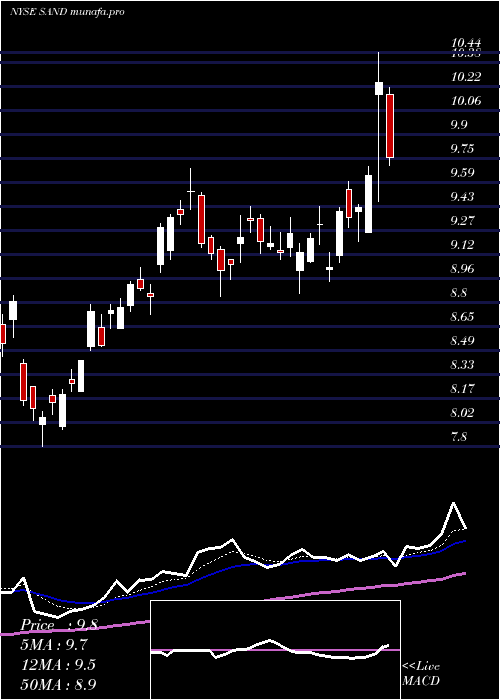
Daily price and charts and targets SandstormGold Strong Daily Stock price targets for SandstormGold SAND are 11.05 and 11.32 | Daily Target 1 | 10.83 | | Daily Target 2 | 11 | | Daily Target 3 | 11.103333333333 | | Daily Target 4 | 11.27 | | Daily Target 5 | 11.37 |
Daily price and volume Sandstorm Gold
| Date |
Closing |
Open |
Range |
Volume |
Fri 29 August 2025 |
11.16 (1.73%) |
10.96 |
10.94 - 11.21 |
1.0581 times |
Thu 28 August 2025 |
10.97 (-0.36%) |
11.04 |
10.88 - 11.06 |
0.8958 times |
Wed 27 August 2025 |
11.01 (-0.99%) |
11.03 |
10.87 - 11.08 |
1.1162 times |
Tue 26 August 2025 |
11.12 (2.58%) |
10.89 |
10.86 - 11.14 |
1.2181 times |
Mon 25 August 2025 |
10.84 (-1.28%) |
11.10 |
10.80 - 11.11 |
0.9642 times |
Fri 22 August 2025 |
10.98 (1.48%) |
10.75 |
10.71 - 11.01 |
0.8944 times |
Thu 21 August 2025 |
10.82 (2.95%) |
10.51 |
10.49 - 10.82 |
0.8866 times |
Wed 20 August 2025 |
10.51 (1.74%) |
10.43 |
10.40 - 10.52 |
0.8848 times |
Tue 19 August 2025 |
10.33 (-2.55%) |
10.56 |
10.32 - 10.60 |
1.0432 times |
Mon 18 August 2025 |
10.60 (-0.09%) |
10.61 |
10.54 - 10.71 |
1.0387 times |
Fri 15 August 2025 |
10.61 (1.24%) |
10.50 |
10.39 - 10.65 |
0.9117 times |
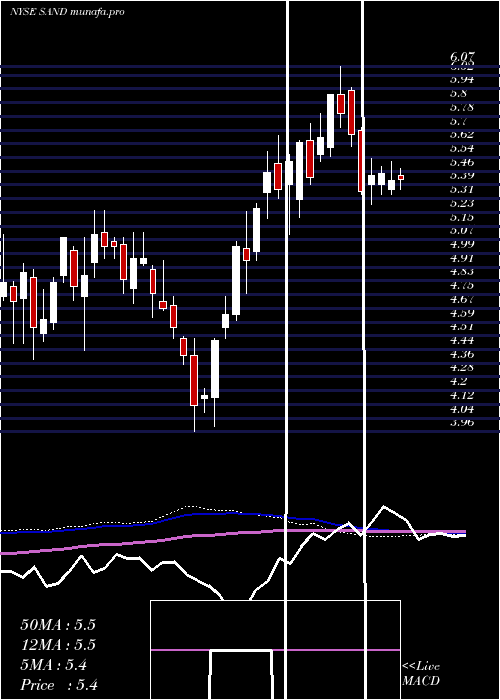
Weekly price and charts SandstormGold Strong weekly Stock price targets for SandstormGold SAND are 10.98 and 11.39 | Weekly Target 1 | 10.65 | | Weekly Target 2 | 10.9 | | Weekly Target 3 | 11.056666666667 | | Weekly Target 4 | 11.31 | | Weekly Target 5 | 11.47 |
Weekly price and volumes for Sandstorm Gold
| Date |
Closing |
Open |
Range |
Volume |
Fri 29 August 2025 |
11.16 (1.64%) |
11.10 |
10.80 - 11.21 |
0.6341 times |
Fri 22 August 2025 |
10.98 (3.49%) |
10.61 |
10.32 - 11.01 |
0.5732 times |
Fri 15 August 2025 |
10.61 (1.82%) |
10.14 |
10.10 - 10.76 |
0.7808 times |
Fri 08 August 2025 |
10.42 (10.5%) |
9.63 |
9.62 - 10.56 |
1.0023 times |
Fri 01 August 2025 |
9.43 (-1.26%) |
9.46 |
9.28 - 9.60 |
0.8886 times |
Fri 25 July 2025 |
9.55 (-0.21%) |
9.69 |
9.43 - 9.85 |
1.0122 times |
Fri 18 July 2025 |
9.57 (-2.94%) |
9.80 |
9.42 - 10.05 |
1.1823 times |
Fri 11 July 2025 |
9.86 (2.39%) |
10.16 |
9.46 - 10.44 |
2.7775 times |
Thu 03 July 2025 |
9.63 (6.64%) |
9.11 |
9.06 - 9.69 |
0.4863 times |
Fri 27 June 2025 |
9.03 (-1.1%) |
9.16 |
8.86 - 9.43 |
0.6628 times |
Fri 20 June 2025 |
9.13 (-2.25%) |
9.35 |
9.08 - 9.38 |
0.4668 times |
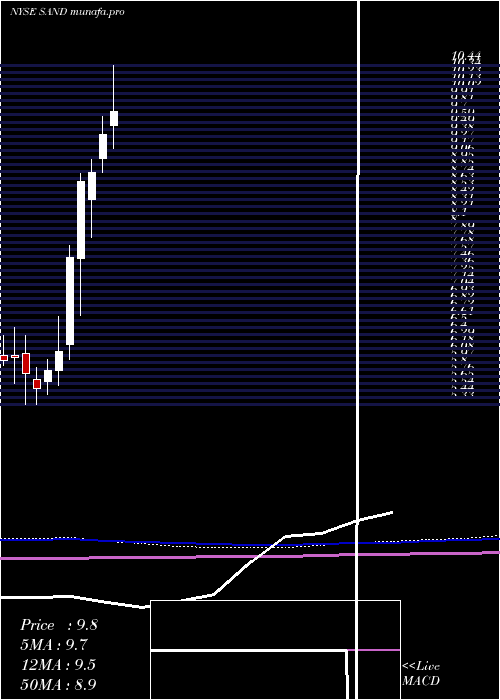
Monthly price and charts SandstormGold Strong monthly Stock price targets for SandstormGold SAND are 10.26 and 12.11 | Monthly Target 1 | 8.73 | | Monthly Target 2 | 9.94 | | Monthly Target 3 | 10.576666666667 | | Monthly Target 4 | 11.79 | | Monthly Target 5 | 12.43 |
Monthly price and volumes Sandstorm Gold
| Date |
Closing |
Open |
Range |
Volume |
Fri 29 August 2025 |
11.16 (19.23%) |
9.50 |
9.36 - 11.21 |
1.028 times |
Thu 31 July 2025 |
9.36 (-0.43%) |
9.54 |
9.20 - 10.44 |
1.9596 times |
Mon 30 June 2025 |
9.40 (6.33%) |
9.05 |
8.84 - 9.68 |
0.9377 times |
Fri 30 May 2025 |
8.84 (1.61%) |
8.43 |
7.86 - 9.03 |
0.9378 times |
Wed 30 April 2025 |
8.70 (15.23%) |
7.53 |
6.68 - 8.82 |
1.0339 times |
Mon 31 March 2025 |
7.55 (23.16%) |
6.24 |
6.02 - 7.74 |
0.728 times |
Fri 28 February 2025 |
6.13 (4.79%) |
5.85 |
5.62 - 6.67 |
1.1604 times |
Fri 31 January 2025 |
5.85 (4.84%) |
5.68 |
5.48 - 6.02 |
1.048 times |
Tue 31 December 2024 |
5.58 (-3.79%) |
5.72 |
5.33 - 5.89 |
0.5218 times |
Tue 26 November 2024 |
5.80 (-4.13%) |
6.11 |
5.34 - 6.38 |
0.6447 times |
Thu 31 October 2024 |
6.05 (0.83%) |
6.07 |
5.66 - 6.50 |
0.7707 times |
DMA SMA EMA moving averages of Sandstorm Gold SAND
DMA (daily moving average) of Sandstorm Gold SAND
| DMA period | DMA value | | 5 day DMA | 11.02 | | 12 day DMA | 10.79 | | 20 day DMA | 10.55 | | 35 day DMA | 10.14 | | 50 day DMA | 9.93 | | 100 day DMA | 9.27 | | 150 day DMA | 8.34 | | 200 day DMA | 7.67 | EMA (exponential moving average) of Sandstorm Gold SAND
| EMA period | EMA current | EMA prev | EMA prev2 | | 5 day EMA | 11.01 | 10.94 | 10.92 | | 12 day EMA | 10.8 | 10.74 | 10.7 | | 20 day EMA | 10.58 | 10.52 | 10.47 | | 35 day EMA | 10.29 | 10.24 | 10.2 | | 50 day EMA | 9.98 | 9.93 | 9.89 |
SMA (simple moving average) of Sandstorm Gold SAND
| SMA period | SMA current | SMA prev | SMA prev2 | | 5 day SMA | 11.02 | 10.98 | 10.95 | | 12 day SMA | 10.79 | 10.74 | 10.72 | | 20 day SMA | 10.55 | 10.46 | 10.38 | | 35 day SMA | 10.14 | 10.1 | 10.07 | | 50 day SMA | 9.93 | 9.89 | 9.86 | | 100 day SMA | 9.27 | 9.23 | 9.18 | | 150 day SMA | 8.34 | 8.3 | 8.26 | | 200 day SMA | 7.67 | 7.64 | 7.62 |
|
|
