QudianInc QD full analysis,charts,indicators,moving averages,SMA,DMA,EMA,ADX,MACD,RSIQudian Inc QD WideScreen charts, DMA,SMA,EMA technical analysis, forecast prediction, by indicators ADX,MACD,RSI,CCI NYSE stock exchange
operates under Finance sector & deals in Finance Consumer Services
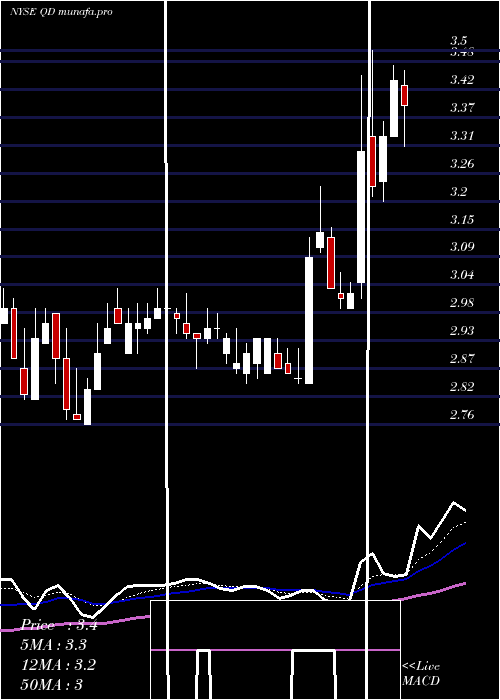
Daily price and charts and targets QudianInc Strong Daily Stock price targets for QudianInc QD are 3.94 and 4.31 | Daily Target 1 | 3.85 | | Daily Target 2 | 4.03 | | Daily Target 3 | 4.2233333333333 | | Daily Target 4 | 4.4 | | Daily Target 5 | 4.59 |
Daily price and volume Qudian Inc
| Date |
Closing |
Open |
Range |
Volume |
Tue 09 December 2025 |
4.20 (-7.08%) |
4.42 |
4.05 - 4.42 |
2.1435 times |
Mon 08 December 2025 |
4.52 (-7.57%) |
4.87 |
4.45 - 4.87 |
1.9019 times |
Fri 05 December 2025 |
4.89 (0.41%) |
4.84 |
4.84 - 4.89 |
0.5972 times |
Thu 04 December 2025 |
4.87 (0.62%) |
4.83 |
4.83 - 4.89 |
0.6457 times |
Wed 03 December 2025 |
4.84 (1.26%) |
4.77 |
4.77 - 4.85 |
0.3599 times |
Tue 02 December 2025 |
4.78 (0.63%) |
4.77 |
4.69 - 4.81 |
0.6186 times |
Mon 01 December 2025 |
4.75 (-1.66%) |
4.77 |
4.66 - 4.84 |
0.6906 times |
Fri 28 November 2025 |
4.83 (-1.02%) |
4.86 |
4.83 - 4.89 |
0.629 times |
Wed 26 November 2025 |
4.88 (0%) |
4.85 |
4.79 - 4.91 |
0.9853 times |
Tue 25 November 2025 |
4.88 (1.24%) |
4.86 |
4.76 - 4.91 |
1.4283 times |
Mon 24 November 2025 |
4.82 (10.3%) |
4.40 |
4.40 - 4.88 |
2.0084 times |
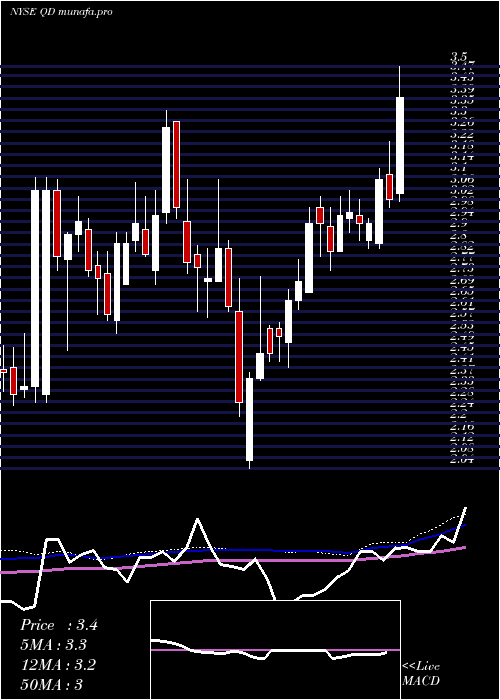
Weekly price and charts QudianInc Strong weekly Stock price targets for QudianInc QD are 3.72 and 4.54 | Weekly Target 1 | 3.55 | | Weekly Target 2 | 3.88 | | Weekly Target 3 | 4.3733333333333 | | Weekly Target 4 | 4.7 | | Weekly Target 5 | 5.19 |
Weekly price and volumes for Qudian Inc
| Date |
Closing |
Open |
Range |
Volume |
Tue 09 December 2025 |
4.20 (-14.11%) |
4.87 |
4.05 - 4.87 |
0.9366 times |
Fri 05 December 2025 |
4.89 (1.24%) |
4.77 |
4.66 - 4.89 |
0.6742 times |
Fri 28 November 2025 |
4.83 (10.53%) |
4.40 |
4.40 - 4.91 |
1.1694 times |
Fri 21 November 2025 |
4.37 (-11%) |
4.84 |
4.28 - 4.95 |
1.2743 times |
Fri 14 November 2025 |
4.91 (3.37%) |
4.81 |
4.64 - 4.95 |
0.8864 times |
Fri 07 November 2025 |
4.75 (-0.63%) |
4.89 |
4.62 - 5.05 |
1.1016 times |
Fri 31 October 2025 |
4.78 (0%) |
4.51 |
4.51 - 4.83 |
0.1764 times |
Fri 31 October 2025 |
4.78 (7.66%) |
4.47 |
4.47 - 4.94 |
1.3876 times |
Fri 24 October 2025 |
4.44 (1.6%) |
4.37 |
4.29 - 4.51 |
1.1477 times |
Fri 17 October 2025 |
4.37 (-5.21%) |
4.25 |
4.25 - 4.70 |
1.2458 times |
Tue 07 October 2025 |
4.61 (3.6%) |
4.30 |
4.28 - 4.77 |
0.7566 times |
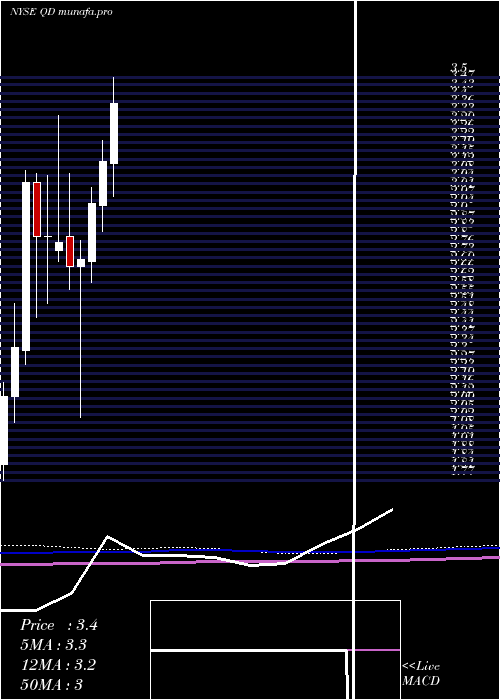
Monthly price and charts QudianInc Strong monthly Stock price targets for QudianInc QD are 3.71 and 4.55 | Monthly Target 1 | 3.54 | | Monthly Target 2 | 3.87 | | Monthly Target 3 | 4.38 | | Monthly Target 4 | 4.71 | | Monthly Target 5 | 5.22 |
Monthly price and volumes Qudian Inc
| Date |
Closing |
Open |
Range |
Volume |
Tue 09 December 2025 |
4.20 (-13.04%) |
4.77 |
4.05 - 4.89 |
0.2394 times |
Fri 28 November 2025 |
4.83 (1.05%) |
4.89 |
4.28 - 5.05 |
0.6588 times |
Fri 31 October 2025 |
4.78 (11.94%) |
4.28 |
4.25 - 4.94 |
0.8114 times |
Tue 30 September 2025 |
4.27 (-6.36%) |
4.50 |
3.80 - 4.75 |
0.9128 times |
Fri 29 August 2025 |
4.56 (12.87%) |
3.95 |
3.83 - 5.08 |
1.6031 times |
Thu 31 July 2025 |
4.04 (28.66%) |
3.13 |
2.99 - 4.07 |
1.21 times |
Mon 30 June 2025 |
3.14 (6.08%) |
2.95 |
2.84 - 3.23 |
1.2679 times |
Fri 30 May 2025 |
2.96 (8.82%) |
2.71 |
2.62 - 3.03 |
0.9968 times |
Wed 30 April 2025 |
2.72 (1.12%) |
2.69 |
2.04 - 2.80 |
1.2526 times |
Mon 31 March 2025 |
2.69 (-3.58%) |
2.82 |
2.59 - 3.09 |
1.047 times |
Fri 28 February 2025 |
2.79 (-1.06%) |
2.76 |
2.71 - 3.34 |
1.0425 times |
DMA SMA EMA moving averages of Qudian Inc QD
DMA (daily moving average) of Qudian Inc QD
| DMA period | DMA value | | 5 day DMA | 4.66 | | 12 day DMA | 4.72 | | 20 day DMA | 4.74 | | 35 day DMA | 4.71 | | 50 day DMA | 4.63 | | 100 day DMA | 4.38 | | 150 day DMA | 3.92 | | 200 day DMA | 3.61 | EMA (exponential moving average) of Qudian Inc QD
| EMA period | EMA current | EMA prev | EMA prev2 | | 5 day EMA | 4.55 | 4.73 | 4.84 | | 12 day EMA | 4.68 | 4.77 | 4.81 | | 20 day EMA | 4.69 | 4.74 | 4.76 | | 35 day EMA | 4.65 | 4.68 | 4.69 | | 50 day EMA | 4.58 | 4.6 | 4.6 |
SMA (simple moving average) of Qudian Inc QD
| SMA period | SMA current | SMA prev | SMA prev2 | | 5 day SMA | 4.66 | 4.78 | 4.83 | | 12 day SMA | 4.72 | 4.75 | 4.76 | | 20 day SMA | 4.74 | 4.77 | 4.78 | | 35 day SMA | 4.71 | 4.72 | 4.71 | | 50 day SMA | 4.63 | 4.63 | 4.63 | | 100 day SMA | 4.38 | 4.38 | 4.37 | | 150 day SMA | 3.92 | 3.91 | 3.89 | | 200 day SMA | 3.61 | 3.6 | 3.59 |
|
|
