PlymouthIndustrial PLYM full analysis,charts,indicators,moving averages,SMA,DMA,EMA,ADX,MACD,RSIPlymouth Industrial PLYM WideScreen charts, DMA,SMA,EMA technical analysis, forecast prediction, by indicators ADX,MACD,RSI,CCI NYSE stock exchange
Daily price and charts and targets PlymouthIndustrial Strong Daily Stock price targets for PlymouthIndustrial PLYM are 21.77 and 21.87 | Daily Target 1 | 21.74 | | Daily Target 2 | 21.79 | | Daily Target 3 | 21.843333333333 | | Daily Target 4 | 21.89 | | Daily Target 5 | 21.94 |
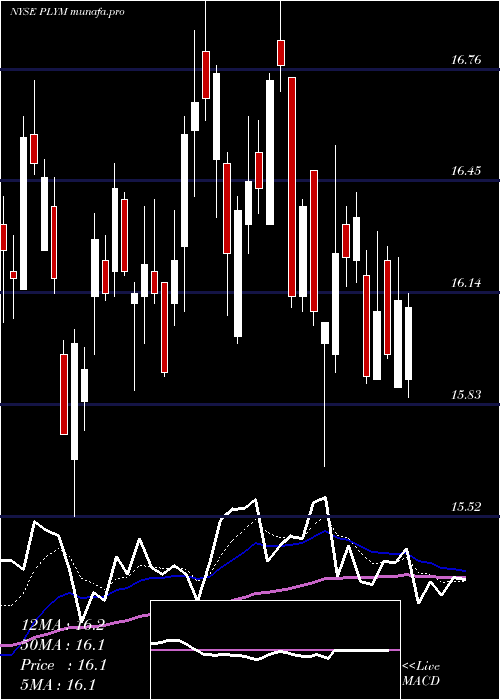
Daily price and volume Plymouth Industrial
| Date |
Closing |
Open |
Range |
Volume |
Tue 09 December 2025 |
21.83 (0.14%) |
21.86 |
21.80 - 21.90 |
1.4345 times |
Mon 08 December 2025 |
21.80 (-0.32%) |
21.87 |
21.77 - 21.87 |
1.3241 times |
Fri 05 December 2025 |
21.87 (-0.18%) |
21.93 |
21.86 - 21.93 |
0.1705 times |
Thu 04 December 2025 |
21.91 (-0.32%) |
21.95 |
21.83 - 22.00 |
0.6118 times |
Wed 03 December 2025 |
21.98 (0.18%) |
22.00 |
21.93 - 22.00 |
0.5006 times |
Tue 02 December 2025 |
21.94 (-0.14%) |
21.96 |
21.91 - 21.97 |
0.6626 times |
Mon 01 December 2025 |
21.97 (0.14%) |
22.00 |
21.90 - 22.00 |
0.9878 times |
Fri 28 November 2025 |
21.94 (-0.27%) |
22.05 |
21.90 - 22.25 |
1.1166 times |
Wed 26 November 2025 |
22.00 (-3%) |
22.10 |
21.90 - 22.20 |
2.1709 times |
Tue 25 November 2025 |
22.68 (2.25%) |
22.24 |
22.19 - 22.74 |
1.0205 times |
Mon 24 November 2025 |
22.18 (-0.22%) |
22.25 |
22.15 - 22.25 |
0.531 times |
Weekly price and charts PlymouthIndustrial Strong weekly Stock price targets for PlymouthIndustrial PLYM are 21.74 and 21.87 | Weekly Target 1 | 21.7 | | Weekly Target 2 | 21.77 | | Weekly Target 3 | 21.833333333333 | | Weekly Target 4 | 21.9 | | Weekly Target 5 | 21.96 |
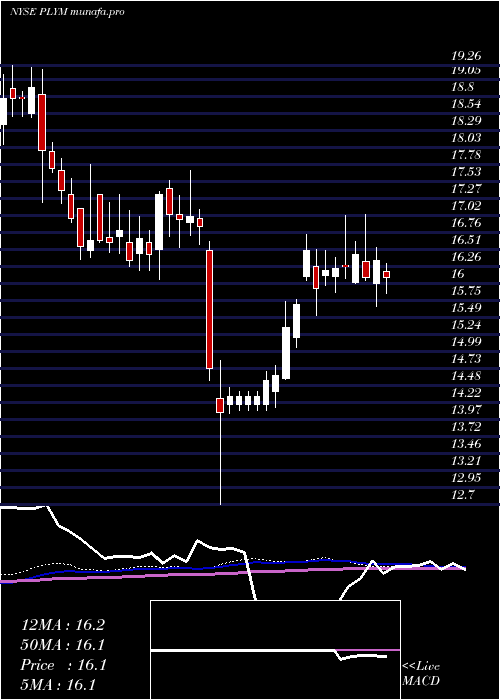
Weekly price and volumes for Plymouth Industrial
| Date |
Closing |
Open |
Range |
Volume |
Tue 09 December 2025 |
21.83 (-0.18%) |
21.87 |
21.77 - 21.90 |
1.1053 times |
Fri 05 December 2025 |
21.87 (-0.32%) |
22.00 |
21.83 - 22.00 |
1.1753 times |
Fri 28 November 2025 |
21.94 (-1.3%) |
22.25 |
21.90 - 22.74 |
1.9389 times |
Fri 21 November 2025 |
22.23 (-0.36%) |
22.33 |
21.95 - 22.38 |
0.7606 times |
Fri 14 November 2025 |
22.31 (0.09%) |
22.26 |
22.07 - 22.31 |
0.5614 times |
Fri 07 November 2025 |
22.29 (1.32%) |
22.00 |
21.98 - 22.29 |
0.5491 times |
Fri 31 October 2025 |
22.00 (0%) |
21.96 |
21.93 - 22.07 |
0.1956 times |
Fri 31 October 2025 |
22.00 (-0.36%) |
21.82 |
21.79 - 22.07 |
2.7598 times |
Fri 24 October 2025 |
22.08 (-0.27%) |
22.15 |
21.91 - 22.24 |
0.3094 times |
Fri 17 October 2025 |
22.14 (0.68%) |
21.19 |
21.12 - 22.26 |
0.6447 times |
Tue 07 October 2025 |
21.99 (-0.63%) |
22.15 |
21.84 - 22.16 |
0.2511 times |
Monthly price and charts PlymouthIndustrial Strong monthly Stock price targets for PlymouthIndustrial PLYM are 21.69 and 21.92 | Monthly Target 1 | 21.64 | | Monthly Target 2 | 21.73 | | Monthly Target 3 | 21.866666666667 | | Monthly Target 4 | 21.96 | | Monthly Target 5 | 22.1 |
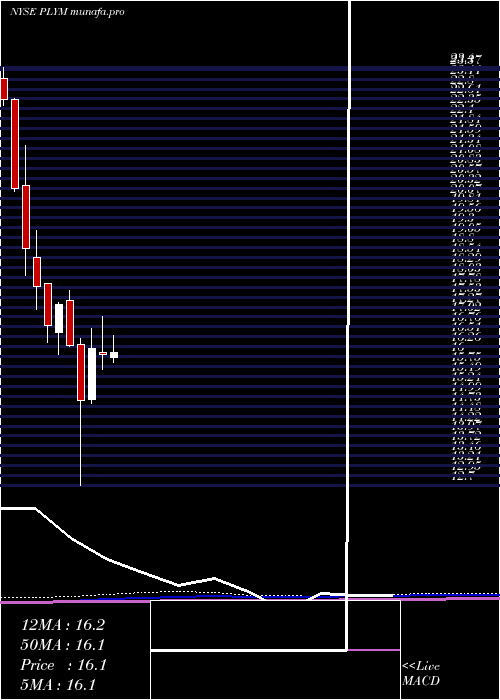
Monthly price and volumes Plymouth Industrial
| Date |
Closing |
Open |
Range |
Volume |
Tue 09 December 2025 |
21.83 (-0.5%) |
22.00 |
21.77 - 22.00 |
0.9943 times |
Fri 28 November 2025 |
21.94 (-0.27%) |
22.00 |
21.90 - 22.74 |
1.661 times |
Fri 31 October 2025 |
22.00 (-1.48%) |
22.23 |
21.12 - 22.60 |
1.916 times |
Tue 30 September 2025 |
22.33 (1.5%) |
21.81 |
21.37 - 22.44 |
1.1794 times |
Fri 29 August 2025 |
22.00 (51.52%) |
14.54 |
14.05 - 22.65 |
1.7268 times |
Thu 31 July 2025 |
14.52 (-9.59%) |
15.97 |
14.45 - 16.55 |
0.4952 times |
Mon 30 June 2025 |
16.06 (-0.86%) |
16.11 |
15.66 - 17.04 |
0.5399 times |
Fri 30 May 2025 |
16.20 (8.94%) |
14.90 |
14.79 - 16.73 |
0.4448 times |
Wed 30 April 2025 |
14.87 (-8.77%) |
16.31 |
12.70 - 16.48 |
0.5274 times |
Mon 31 March 2025 |
16.30 (-6%) |
17.43 |
16.25 - 17.69 |
0.5152 times |
Fri 28 February 2025 |
17.34 (3.21%) |
16.61 |
16.06 - 17.38 |
0.4254 times |
DMA SMA EMA moving averages of Plymouth Industrial PLYM
DMA (daily moving average) of Plymouth Industrial PLYM
| DMA period | DMA value | | 5 day DMA | 21.88 | | 12 day DMA | 22.03 | | 20 day DMA | 22.09 | | 35 day DMA | 22.07 | | 50 day DMA | 22.04 | | 100 day DMA | 20.36 | | 150 day DMA | 18.95 | | 200 day DMA | 18.16 | EMA (exponential moving average) of Plymouth Industrial PLYM
| EMA period | EMA current | EMA prev | EMA prev2 | | 5 day EMA | 21.87 | 21.89 | 21.94 | | 12 day EMA | 21.97 | 21.99 | 22.02 | | 20 day EMA | 22 | 22.02 | 22.04 | | 35 day EMA | 22.02 | 22.03 | 22.04 | | 50 day EMA | 22 | 22.01 | 22.02 |
SMA (simple moving average) of Plymouth Industrial PLYM
| SMA period | SMA current | SMA prev | SMA prev2 | | 5 day SMA | 21.88 | 21.9 | 21.93 | | 12 day SMA | 22.03 | 22.04 | 22.07 | | 20 day SMA | 22.09 | 22.1 | 22.13 | | 35 day SMA | 22.07 | 22.07 | 22.08 | | 50 day SMA | 22.04 | 22.04 | 22.04 | | 100 day SMA | 20.36 | 20.3 | 20.24 | | 150 day SMA | 18.95 | 18.9 | 18.85 | | 200 day SMA | 18.16 | 18.13 | 18.11 |
|
|
