ParamountGroup PGRE full analysis,charts,indicators,moving averages,SMA,DMA,EMA,ADX,MACD,RSIParamount Group PGRE WideScreen charts, DMA,SMA,EMA technical analysis, forecast prediction, by indicators ADX,MACD,RSI,CCI NYSE stock exchange
operates under Consumer Services sector & deals in Real Estate Investment Trusts
Daily price and charts and targets ParamountGroup Strong Daily Stock price targets for ParamountGroup PGRE are 6.57 and 6.59 | Daily Target 1 | 6.56 | | Daily Target 2 | 6.57 | | Daily Target 3 | 6.58 | | Daily Target 4 | 6.59 | | Daily Target 5 | 6.6 |
Daily price and volume Paramount Group
| Date |
Closing |
Open |
Range |
Volume |
Tue 09 December 2025 |
6.58 (0.3%) |
6.58 |
6.57 - 6.59 |
2.1391 times |
Mon 08 December 2025 |
6.56 (-0.15%) |
6.59 |
6.56 - 6.59 |
2.1703 times |
Fri 05 December 2025 |
6.57 (-0.15%) |
6.58 |
6.57 - 6.59 |
0.436 times |
Thu 04 December 2025 |
6.58 (-0.15%) |
6.59 |
6.58 - 6.59 |
0.5588 times |
Wed 03 December 2025 |
6.59 (0.15%) |
6.59 |
6.58 - 6.59 |
0.7172 times |
Tue 02 December 2025 |
6.58 (0%) |
6.59 |
6.58 - 6.59 |
0.5392 times |
Mon 01 December 2025 |
6.58 (-0.15%) |
6.59 |
6.58 - 6.59 |
0.6484 times |
Fri 28 November 2025 |
6.59 (0.15%) |
6.59 |
6.58 - 6.59 |
0.4866 times |
Wed 26 November 2025 |
6.58 (0%) |
6.57 |
6.57 - 6.59 |
0.7903 times |
Tue 25 November 2025 |
6.58 (0%) |
6.57 |
6.57 - 6.59 |
1.5141 times |
Mon 24 November 2025 |
6.58 (0.15%) |
6.56 |
6.56 - 6.58 |
0.8669 times |
Weekly price and charts ParamountGroup Strong weekly Stock price targets for ParamountGroup PGRE are 6.56 and 6.59 | Weekly Target 1 | 6.55 | | Weekly Target 2 | 6.56 | | Weekly Target 3 | 6.5766666666667 | | Weekly Target 4 | 6.59 | | Weekly Target 5 | 6.61 |
Weekly price and volumes for Paramount Group
| Date |
Closing |
Open |
Range |
Volume |
Tue 09 December 2025 |
6.58 (0.15%) |
6.59 |
6.56 - 6.59 |
0.9136 times |
Fri 05 December 2025 |
6.57 (-0.3%) |
6.59 |
6.57 - 6.59 |
0.6147 times |
Fri 28 November 2025 |
6.59 (0.3%) |
6.56 |
6.56 - 6.59 |
0.7755 times |
Fri 21 November 2025 |
6.57 (0.31%) |
6.55 |
6.54 - 6.57 |
1.3299 times |
Fri 14 November 2025 |
6.55 (0%) |
6.56 |
6.55 - 6.58 |
0.572 times |
Fri 07 November 2025 |
6.55 (0.15%) |
6.55 |
6.54 - 6.56 |
0.7137 times |
Fri 31 October 2025 |
6.54 (0%) |
6.53 |
6.53 - 6.55 |
0.5152 times |
Fri 31 October 2025 |
6.54 (0.31%) |
6.53 |
6.52 - 6.55 |
1.5388 times |
Fri 24 October 2025 |
6.52 (-0.31%) |
6.54 |
6.52 - 6.54 |
0.8281 times |
Fri 17 October 2025 |
6.54 (0%) |
6.54 |
6.52 - 6.55 |
2.1985 times |
Tue 07 October 2025 |
6.54 (0.15%) |
6.53 |
6.52 - 6.54 |
1.1713 times |
Monthly price and charts ParamountGroup Strong monthly Stock price targets for ParamountGroup PGRE are 6.56 and 6.59 | Monthly Target 1 | 6.55 | | Monthly Target 2 | 6.56 | | Monthly Target 3 | 6.5766666666667 | | Monthly Target 4 | 6.59 | | Monthly Target 5 | 6.61 |
Monthly price and volumes Paramount Group
| Date |
Closing |
Open |
Range |
Volume |
Tue 09 December 2025 |
6.58 (-0.15%) |
6.59 |
6.56 - 6.59 |
0.2056 times |
Fri 28 November 2025 |
6.59 (0.76%) |
6.55 |
6.54 - 6.59 |
0.4561 times |
Fri 31 October 2025 |
6.54 (0%) |
6.53 |
6.50 - 6.55 |
1.1068 times |
Tue 30 September 2025 |
6.54 (-9.17%) |
7.11 |
6.51 - 7.85 |
2.394 times |
Fri 29 August 2025 |
7.20 (17.65%) |
6.01 |
6.00 - 7.26 |
1.187 times |
Thu 31 July 2025 |
6.12 (0.33%) |
6.07 |
5.75 - 6.89 |
1.0857 times |
Mon 30 June 2025 |
6.10 (0.83%) |
6.05 |
5.94 - 6.62 |
0.9199 times |
Fri 30 May 2025 |
6.05 (41.03%) |
4.25 |
4.10 - 6.34 |
1.1237 times |
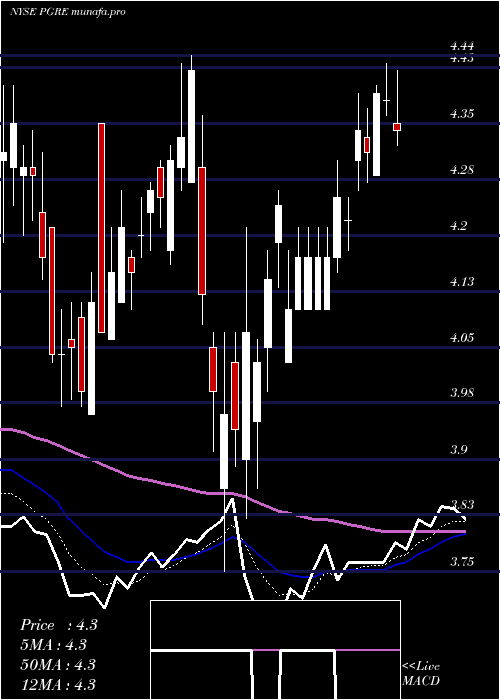
Wed 30 April 2025 |
4.29 (-0.23%) |
4.29 |
3.75 - 4.44 |
1.0432 times |
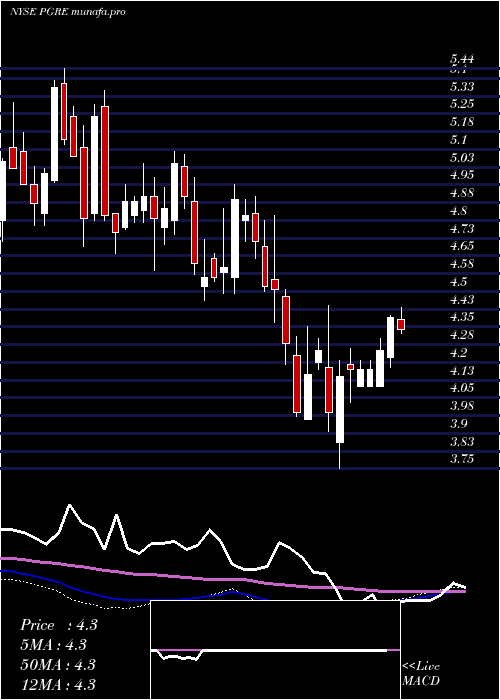
Mon 31 March 2025 |
4.30 (-4.66%) |
4.48 |
3.96 - 4.51 |
0.4782 times |
Fri 28 February 2025 |
4.51 (-7.77%) |
4.80 |
4.37 - 4.90 |
0.2466 times |

DMA SMA EMA moving averages of Paramount Group PGRE
DMA (daily moving average) of Paramount Group PGRE
| DMA period | DMA value | | 5 day DMA | 6.58 | | 12 day DMA | 6.58 | | 20 day DMA | 6.57 | | 35 day DMA | 6.56 | | 50 day DMA | 6.55 | | 100 day DMA | 6.64 | | 150 day DMA | 6.37 | | 200 day DMA | 5.84 | EMA (exponential moving average) of Paramount Group PGRE
| EMA period | EMA current | EMA prev | EMA prev2 | | 5 day EMA | 6.57 | 6.57 | 6.58 | | 12 day EMA | 6.56 | 6.56 | 6.56 | | 20 day EMA | 6.54 | 6.54 | 6.54 | | 35 day EMA | 6.53 | 6.53 | 6.53 | | 50 day EMA | 6.54 | 6.54 | 6.54 |
SMA (simple moving average) of Paramount Group PGRE
| SMA period | SMA current | SMA prev | SMA prev2 | | 5 day SMA | 6.58 | 6.58 | 6.58 | | 12 day SMA | 6.58 | 6.58 | 6.58 | | 20 day SMA | 6.57 | 6.57 | 6.57 | | 35 day SMA | 6.56 | 6.55 | 6.55 | | 50 day SMA | 6.55 | 6.55 | 6.55 | | 100 day SMA | 6.64 | 6.64 | 6.65 | | 150 day SMA | 6.37 | 6.36 | 6.34 | | 200 day SMA | 5.84 | 5.83 | 5.82 |
|
|
