BlackrockMuniholdings MUE full analysis,charts,indicators,moving averages,SMA,DMA,EMA,ADX,MACD,RSIBlackrock Muniholdings MUE WideScreen charts, DMA,SMA,EMA technical analysis, forecast prediction, by indicators ADX,MACD,RSI,CCI NYSE stock exchange
operates under N A sector & deals in N A
Daily price and charts and targets BlackrockMuniholdings Strong Daily Stock price targets for BlackrockMuniholdings MUE are 10.02 and 10.08 | Daily Target 1 | 9.98 | | Daily Target 2 | 10 | | Daily Target 3 | 10.036666666667 | | Daily Target 4 | 10.06 | | Daily Target 5 | 10.1 |
Daily price and volume Blackrock Muniholdings
| Date |
Closing |
Open |
Range |
Volume |
Fri 07 November 2025 |
10.03 (-0.5%) |
10.01 |
10.01 - 10.07 |
1.1964 times |
Thu 06 November 2025 |
10.08 (0.5%) |
10.08 |
10.06 - 10.11 |
0.7623 times |
Wed 05 November 2025 |
10.03 (-0.59%) |
10.06 |
10.02 - 10.13 |
1.0049 times |
Tue 04 November 2025 |
10.09 (-0.2%) |
10.04 |
10.00 - 10.11 |
0.7138 times |
Fri 31 October 2025 |
10.11 (0%) |
10.05 |
10.02 - 10.14 |
1.1031 times |
Fri 31 October 2025 |
10.11 (0.2%) |
10.05 |
10.02 - 10.14 |
1.1031 times |
Thu 30 October 2025 |
10.09 (-0.2%) |
10.08 |
10.05 - 10.10 |
0.7536 times |
Wed 29 October 2025 |
10.11 (0%) |
10.11 |
10.07 - 10.11 |
0.9651 times |
Tue 28 October 2025 |
10.11 (-0.3%) |
10.11 |
10.08 - 10.15 |
1.5595 times |
Mon 27 October 2025 |
10.14 (0%) |
10.14 |
10.10 - 10.14 |
0.8382 times |
Fri 24 October 2025 |
10.14 (0.2%) |
10.12 |
10.09 - 10.16 |
0.6604 times |
Weekly price and charts BlackrockMuniholdings Strong weekly Stock price targets for BlackrockMuniholdings MUE are 9.95 and 10.08 | Weekly Target 1 | 9.92 | | Weekly Target 2 | 9.98 | | Weekly Target 3 | 10.053333333333 | | Weekly Target 4 | 10.11 | | Weekly Target 5 | 10.18 |
Weekly price and volumes for Blackrock Muniholdings
| Date |
Closing |
Open |
Range |
Volume |
Fri 07 November 2025 |
10.03 (-0.79%) |
10.04 |
10.00 - 10.13 |
1.0013 times |
Fri 31 October 2025 |
10.11 (0%) |
10.05 |
10.02 - 10.14 |
0.3004 times |
Fri 31 October 2025 |
10.11 (-0.3%) |
10.14 |
10.02 - 10.15 |
1.4212 times |
Fri 24 October 2025 |
10.14 (0.6%) |
10.09 |
10.05 - 10.16 |
1.0111 times |
Fri 17 October 2025 |
10.08 (0.8%) |
10.06 |
10.00 - 10.12 |
1.5417 times |
Tue 07 October 2025 |
10.00 (0.4%) |
9.96 |
9.87 - 10.02 |
1.1111 times |
Fri 03 October 2025 |
9.96 (-0.4%) |
10.05 |
9.95 - 10.13 |
0.915 times |
Fri 26 September 2025 |
10.00 (-0.4%) |
10.04 |
9.95 - 10.06 |
0.6237 times |
Fri 19 September 2025 |
10.04 (0.1%) |
10.03 |
9.96 - 10.11 |
0.8493 times |
Fri 12 September 2025 |
10.03 (3.4%) |
9.74 |
9.74 - 10.08 |
1.2251 times |
Fri 05 September 2025 |
9.70 (1.68%) |
9.50 |
9.45 - 9.70 |
1.1324 times |

Monthly price and charts BlackrockMuniholdings Strong monthly Stock price targets for BlackrockMuniholdings MUE are 9.95 and 10.08 | Monthly Target 1 | 9.92 | | Monthly Target 2 | 9.98 | | Monthly Target 3 | 10.053333333333 | | Monthly Target 4 | 10.11 | | Monthly Target 5 | 10.18 |
Monthly price and volumes Blackrock Muniholdings
| Date |
Closing |
Open |
Range |
Volume |
Fri 07 November 2025 |
10.03 (-0.79%) |
10.04 |
10.00 - 10.13 |
0.2277 times |
Fri 31 October 2025 |
10.11 (0.5%) |
10.06 |
9.87 - 10.16 |
1.3651 times |
Tue 30 September 2025 |
10.06 (5.45%) |
9.50 |
9.45 - 10.11 |
0.9392 times |
Fri 29 August 2025 |
9.54 (1.49%) |
9.43 |
9.37 - 9.64 |
1.3257 times |
Thu 31 July 2025 |
9.40 (-1.88%) |
9.63 |
9.27 - 9.65 |
1.0379 times |
Mon 30 June 2025 |
9.58 (0.42%) |
9.52 |
9.39 - 9.62 |
1.2308 times |
Fri 30 May 2025 |
9.54 (-2.15%) |
9.75 |
9.45 - 9.91 |
1.0868 times |
Wed 30 April 2025 |
9.75 (-2.5%) |
10.09 |
9.26 - 10.14 |
1.2759 times |
Mon 31 March 2025 |
10.00 (-4.21%) |
10.40 |
9.91 - 10.48 |
0.7443 times |
Fri 28 February 2025 |
10.44 (0.97%) |
10.32 |
10.11 - 10.48 |
0.7666 times |
Fri 31 January 2025 |
10.34 (3.4%) |
10.04 |
9.94 - 10.43 |
0.9041 times |

DMA SMA EMA moving averages of Blackrock Muniholdings MUE
DMA (daily moving average) of Blackrock Muniholdings MUE
| DMA period | DMA value | | 5 day DMA | 10.07 | | 12 day DMA | 10.1 | | 20 day DMA | 10.09 | | 35 day DMA | 10.06 | | 50 day DMA | 9.96 | | 100 day DMA | 9.72 | | 150 day DMA | 9.68 | | 200 day DMA | 9.82 | EMA (exponential moving average) of Blackrock Muniholdings MUE
| EMA period | EMA current | EMA prev | EMA prev2 | | 5 day EMA | 10.06 | 10.08 | 10.08 | | 12 day EMA | 10.07 | 10.08 | 10.08 | | 20 day EMA | 10.06 | 10.06 | 10.06 | | 35 day EMA | 10 | 10 | 10 | | 50 day EMA | 9.93 | 9.93 | 9.92 |
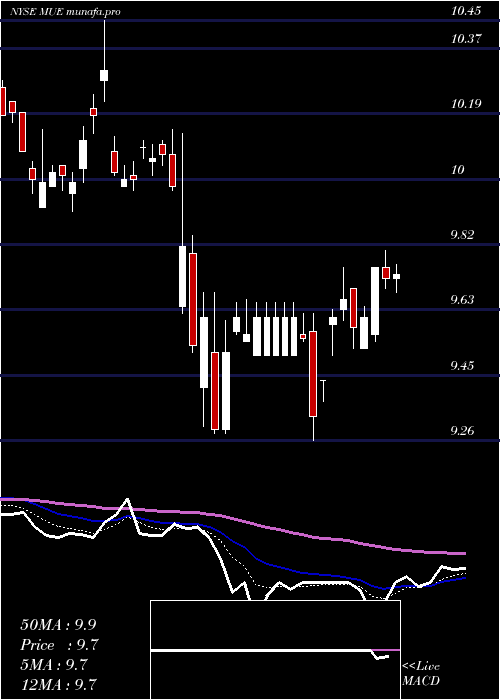
SMA (simple moving average) of Blackrock Muniholdings MUE
| SMA period | SMA current | SMA prev | SMA prev2 | | 5 day SMA | 10.07 | 10.08 | 10.09 | | 12 day SMA | 10.1 | 10.1 | 10.11 | | 20 day SMA | 10.09 | 10.09 | 10.09 | | 35 day SMA | 10.06 | 10.06 | 10.06 | | 50 day SMA | 9.96 | 9.95 | 9.94 | | 100 day SMA | 9.72 | 9.71 | 9.71 | | 150 day SMA | 9.68 | 9.68 | 9.68 | | 200 day SMA | 9.82 | 9.82 | 9.82 |
|
|
