HillenbrandInc HI full analysis,charts,indicators,moving averages,SMA,DMA,EMA,ADX,MACD,RSIHillenbrand Inc HI WideScreen charts, DMA,SMA,EMA technical analysis, forecast prediction, by indicators ADX,MACD,RSI,CCI NYSE stock exchange
operates under Consumer Durables sector & deals in Miscellaneous Manufacturing Industries
Daily price and charts and targets HillenbrandInc Strong Daily Stock price targets for HillenbrandInc HI are 31.76 and 31.86 | Daily Target 1 | 31.74 | | Daily Target 2 | 31.78 | | Daily Target 3 | 31.84 | | Daily Target 4 | 31.88 | | Daily Target 5 | 31.94 |
Daily price and volume Hillenbrand Inc
| Date |
Closing |
Open |
Range |
Volume |
Tue 09 December 2025 |
31.82 (-0.25%) |
31.85 |
31.80 - 31.90 |
1.2394 times |
Mon 08 December 2025 |
31.90 (0.19%) |
31.84 |
31.84 - 32.07 |
0.74 times |
Fri 05 December 2025 |
31.84 (0.19%) |
31.80 |
31.79 - 31.85 |
0.6179 times |
Thu 04 December 2025 |
31.78 (-0.19%) |
31.84 |
31.76 - 31.84 |
0.9262 times |
Wed 03 December 2025 |
31.84 (0.13%) |
31.80 |
31.80 - 31.84 |
0.8045 times |
Tue 02 December 2025 |
31.80 (0.22%) |
31.83 |
31.77 - 31.84 |
0.8464 times |
Mon 01 December 2025 |
31.73 (-0.35%) |
31.80 |
31.73 - 31.85 |
0.7979 times |
Fri 28 November 2025 |
31.84 (0.54%) |
31.75 |
31.62 - 31.85 |
0.6143 times |
Wed 26 November 2025 |
31.67 (-0.22%) |
31.75 |
31.65 - 31.87 |
1.7271 times |
Tue 25 November 2025 |
31.74 (0.06%) |
31.72 |
31.70 - 31.76 |
1.6863 times |
Mon 24 November 2025 |
31.72 (0.25%) |
31.66 |
31.65 - 31.75 |
1.3816 times |
Weekly price and charts HillenbrandInc Strong weekly Stock price targets for HillenbrandInc HI are 31.68 and 31.95 | Weekly Target 1 | 31.63 | | Weekly Target 2 | 31.72 | | Weekly Target 3 | 31.896666666667 | | Weekly Target 4 | 31.99 | | Weekly Target 5 | 32.17 |
Weekly price and volumes for Hillenbrand Inc
| Date |
Closing |
Open |
Range |
Volume |
Tue 09 December 2025 |
31.82 (-0.06%) |
31.84 |
31.80 - 32.07 |
0.1644 times |
Fri 05 December 2025 |
31.84 (0%) |
31.80 |
31.73 - 31.85 |
0.3316 times |
Fri 28 November 2025 |
31.84 (0.63%) |
31.66 |
31.62 - 31.87 |
0.4492 times |
Fri 21 November 2025 |
31.64 (0%) |
31.64 |
31.54 - 31.70 |
0.5939 times |
Fri 14 November 2025 |
31.64 (-0.13%) |
31.68 |
31.60 - 31.75 |
0.4281 times |
Fri 07 November 2025 |
31.68 (0.25%) |
31.56 |
31.56 - 31.68 |
0.4301 times |
Fri 31 October 2025 |
31.60 (0%) |
31.55 |
31.54 - 31.64 |
0.1856 times |
Fri 31 October 2025 |
31.60 (0.73%) |
31.55 |
31.40 - 31.64 |
1.1917 times |
Fri 24 October 2025 |
31.37 (-0.38%) |
31.53 |
31.37 - 31.59 |
1.002 times |
Fri 17 October 2025 |
31.49 (28.16%) |
25.25 |
25.02 - 31.54 |
5.2233 times |
Fri 10 October 2025 |
24.57 (-8.42%) |
27.23 |
24.55 - 27.24 |
0.3189 times |

Monthly price and charts HillenbrandInc Strong monthly Stock price targets for HillenbrandInc HI are 31.78 and 32.12 | Monthly Target 1 | 31.53 | | Monthly Target 2 | 31.68 | | Monthly Target 3 | 31.873333333333 | | Monthly Target 4 | 32.02 | | Monthly Target 5 | 32.21 |
Monthly price and volumes Hillenbrand Inc
| Date |
Closing |
Open |
Range |
Volume |
Tue 09 December 2025 |
31.82 (-0.06%) |
31.80 |
31.73 - 32.07 |
0.2536 times |
Fri 28 November 2025 |
31.84 (0.76%) |
31.56 |
31.54 - 31.87 |
0.9723 times |
Fri 31 October 2025 |
31.60 (16.86%) |
26.85 |
24.55 - 31.64 |
4.1289 times |
Tue 30 September 2025 |
27.04 (6.5%) |
24.77 |
22.98 - 27.30 |
0.686 times |
Fri 29 August 2025 |
25.39 (22.6%) |
20.10 |
19.28 - 27.08 |
0.8827 times |
Thu 31 July 2025 |
20.71 (3.19%) |
19.89 |
19.89 - 23.60 |
0.5857 times |
Mon 30 June 2025 |
20.07 (2.71%) |
19.49 |
18.46 - 22.26 |
0.5282 times |
Fri 30 May 2025 |
19.54 (-3.41%) |
20.32 |
18.62 - 23.37 |
0.7887 times |
Wed 30 April 2025 |
20.23 (-16.2%) |
23.88 |
18.36 - 24.81 |
0.6691 times |
Mon 31 March 2025 |
24.14 (-19.26%) |
30.03 |
23.81 - 30.05 |
0.5046 times |
Fri 28 February 2025 |
29.90 (-12.03%) |
33.08 |
29.05 - 35.48 |
0.6142 times |

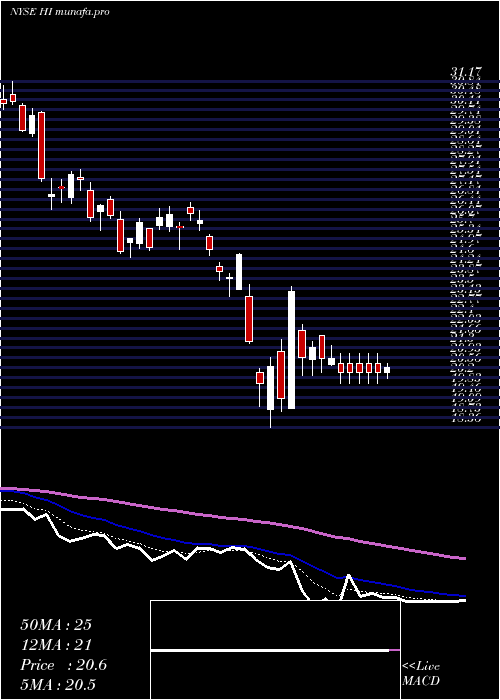
DMA SMA EMA moving averages of Hillenbrand Inc HI
DMA (daily moving average) of Hillenbrand Inc HI
| DMA period | DMA value | | 5 day DMA | 31.84 | | 12 day DMA | 31.78 | | 20 day DMA | 31.72 | | 35 day DMA | 31.65 | | 50 day DMA | 30.46 | | 100 day DMA | 27.15 | | 150 day DMA | 25.05 | | 200 day DMA | 24.75 | EMA (exponential moving average) of Hillenbrand Inc HI
| EMA period | EMA current | EMA prev | EMA prev2 | | 5 day EMA | 31.83 | 31.83 | 31.8 | | 12 day EMA | 31.77 | 31.76 | 31.73 | | 20 day EMA | 31.61 | 31.59 | 31.56 | | 35 day EMA | 30.86 | 30.8 | 30.74 | | 50 day EMA | 30.14 | 30.07 | 30 |
SMA (simple moving average) of Hillenbrand Inc HI
| SMA period | SMA current | SMA prev | SMA prev2 | | 5 day SMA | 31.84 | 31.83 | 31.8 | | 12 day SMA | 31.78 | 31.76 | 31.74 | | 20 day SMA | 31.72 | 31.72 | 31.7 | | 35 day SMA | 31.65 | 31.64 | 31.62 | | 50 day SMA | 30.46 | 30.35 | 30.23 | | 100 day SMA | 27.15 | 27.05 | 26.95 | | 150 day SMA | 25.05 | 24.98 | 24.91 | | 200 day SMA | 24.75 | 24.74 | 24.73 |
|
|
