GmsInc GMS full analysis,charts,indicators,moving averages,SMA,DMA,EMA,ADX,MACD,RSIGms Inc GMS WideScreen charts, DMA,SMA,EMA technical analysis, forecast prediction, by indicators ADX,MACD,RSI,CCI NYSE stock exchange
operates under Consumer Services sector & deals in RETAIL Building Materials
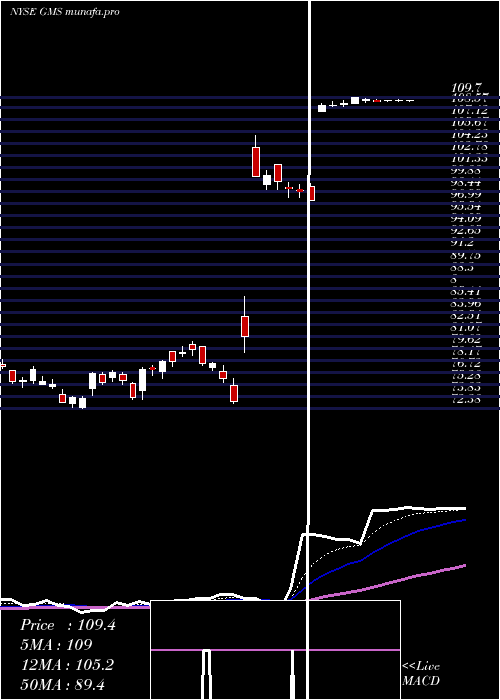
Daily price and charts and targets GmsInc Strong Daily Stock price targets for GmsInc GMS are 109.92 and 109.95 | Daily Target 1 | 109.91 | | Daily Target 2 | 109.92 | | Daily Target 3 | 109.94 | | Daily Target 4 | 109.95 | | Daily Target 5 | 109.97 |
Daily price and volume Gms Inc
| Date |
Closing |
Open |
Range |
Volume |
Fri 29 August 2025 |
109.93 (0.07%) |
109.95 |
109.93 - 109.96 |
1.188 times |
Thu 28 August 2025 |
109.85 (0.01%) |
109.84 |
109.82 - 109.87 |
0.7194 times |
Wed 27 August 2025 |
109.84 (-0.01%) |
109.85 |
109.84 - 109.89 |
0.6107 times |
Tue 26 August 2025 |
109.85 (0.02%) |
109.84 |
109.83 - 109.88 |
0.8269 times |
Mon 25 August 2025 |
109.83 (-0.06%) |
109.90 |
109.83 - 109.90 |
0.98 times |
Fri 22 August 2025 |
109.90 (0.06%) |
109.85 |
109.82 - 109.90 |
0.9865 times |
Thu 21 August 2025 |
109.83 (0.26%) |
109.86 |
109.80 - 109.89 |
1.9625 times |
Wed 20 August 2025 |
109.54 (0.06%) |
109.52 |
109.46 - 109.56 |
1.4207 times |
Tue 19 August 2025 |
109.47 (-0.03%) |
109.55 |
109.43 - 109.59 |
0.5524 times |
Mon 18 August 2025 |
109.50 (0.07%) |
109.60 |
109.37 - 109.60 |
0.7529 times |
Fri 15 August 2025 |
109.42 (-0.24%) |
109.68 |
109.36 - 109.68 |
1.0592 times |
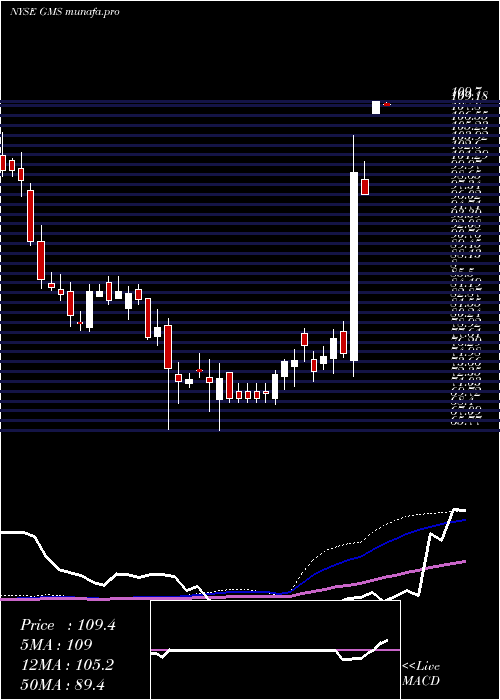
Weekly price and charts GmsInc Strong weekly Stock price targets for GmsInc GMS are 109.88 and 110.02 | Weekly Target 1 | 109.76 | | Weekly Target 2 | 109.85 | | Weekly Target 3 | 109.90333333333 | | Weekly Target 4 | 109.99 | | Weekly Target 5 | 110.04 |
Weekly price and volumes for Gms Inc
| Date |
Closing |
Open |
Range |
Volume |
Fri 29 August 2025 |
109.93 (0.03%) |
109.90 |
109.82 - 109.96 |
0.4969 times |
Fri 22 August 2025 |
109.90 (0.44%) |
109.60 |
109.37 - 109.90 |
0.6519 times |
Fri 15 August 2025 |
109.42 (0%) |
109.49 |
109.36 - 109.80 |
0.4416 times |
Fri 08 August 2025 |
109.42 (-0.17%) |
109.75 |
109.39 - 109.76 |
0.5391 times |
Fri 01 August 2025 |
109.61 (-0.08%) |
109.60 |
109.20 - 109.84 |
0.8779 times |
Fri 25 July 2025 |
109.70 (-0.12%) |
109.90 |
109.45 - 110.11 |
0.9482 times |
Fri 18 July 2025 |
109.83 (0.41%) |
109.40 |
109.40 - 110.28 |
1.3336 times |
Fri 11 July 2025 |
109.38 (-0.29%) |
109.40 |
109.19 - 109.67 |
1.1435 times |
Thu 03 July 2025 |
109.70 (12.71%) |
108.10 |
108.10 - 109.70 |
2.8514 times |
Fri 27 June 2025 |
97.33 (-2.93%) |
99.26 |
97.33 - 101.71 |
0.7159 times |
Fri 20 June 2025 |
100.27 (31.88%) |
75.14 |
73.06 - 105.14 |
1.1744 times |
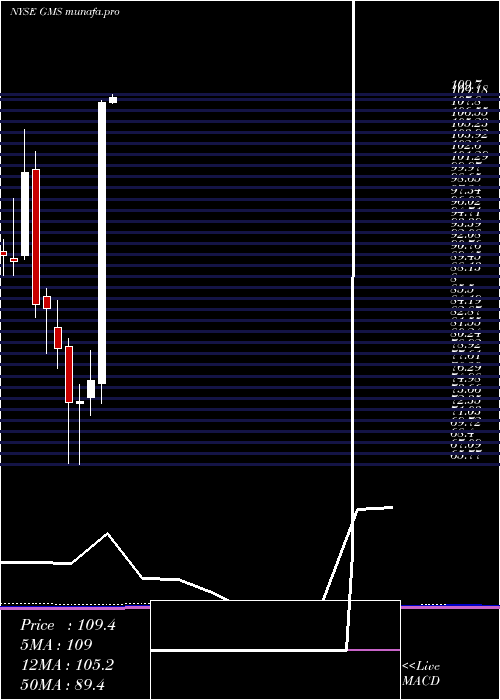
Monthly price and charts GmsInc Strong monthly Stock price targets for GmsInc GMS are 109.57 and 110.33 | Monthly Target 1 | 108.94 | | Monthly Target 2 | 109.43 | | Monthly Target 3 | 109.69666666667 | | Monthly Target 4 | 110.19 | | Monthly Target 5 | 110.46 |
Monthly price and volumes Gms Inc
| Date |
Closing |
Open |
Range |
Volume |
Fri 29 August 2025 |
109.93 (0.26%) |
109.53 |
109.20 - 109.96 |
1.2235 times |
Thu 31 July 2025 |
109.64 (0.82%) |
108.76 |
108.68 - 110.28 |
3.0954 times |
Mon 30 June 2025 |
108.75 (43.6%) |
75.35 |
73.06 - 109.04 |
1.7948 times |
Fri 30 May 2025 |
75.73 (3.37%) |
73.77 |
71.64 - 79.36 |
0.458 times |
Wed 30 April 2025 |
73.26 (0.12%) |
73.07 |
65.77 - 75.31 |
0.4931 times |
Mon 31 March 2025 |
73.17 (-8.09%) |
79.76 |
65.88 - 80.73 |
0.8319 times |
Fri 28 February 2025 |
79.61 (-5.61%) |
82.06 |
77.14 - 85.24 |
0.4527 times |
Fri 31 January 2025 |
84.34 (-0.58%) |
85.69 |
78.99 - 86.68 |
0.56 times |
Tue 31 December 2024 |
84.83 (-15.58%) |
100.80 |
83.22 - 102.97 |
0.5904 times |
Tue 26 November 2024 |
100.48 (11.78%) |
90.61 |
90.15 - 105.54 |
0.5002 times |
Thu 31 October 2024 |
89.89 (-0.75%) |
90.25 |
88.29 - 97.42 |
0.4522 times |
DMA SMA EMA moving averages of Gms Inc GMS
DMA (daily moving average) of Gms Inc GMS
| DMA period | DMA value | | 5 day DMA | 109.86 | | 12 day DMA | 109.72 | | 20 day DMA | 109.65 | | 35 day DMA | 109.68 | | 50 day DMA | 107.78 | | 100 day DMA | 91.05 | | 150 day DMA | 86.69 | | 200 day DMA | 87.8 | EMA (exponential moving average) of Gms Inc GMS
| EMA period | EMA current | EMA prev | EMA prev2 | | 5 day EMA | 109.86 | 109.82 | 109.8 | | 12 day EMA | 109.75 | 109.72 | 109.7 | | 20 day EMA | 109.33 | 109.27 | 109.21 | | 35 day EMA | 107.35 | 107.2 | 107.04 | | 50 day EMA | 105.45 | 105.27 | 105.08 |
SMA (simple moving average) of Gms Inc GMS
| SMA period | SMA current | SMA prev | SMA prev2 | | 5 day SMA | 109.86 | 109.85 | 109.85 | | 12 day SMA | 109.72 | 109.69 | 109.67 | | 20 day SMA | 109.65 | 109.64 | 109.63 | | 35 day SMA | 109.68 | 109.67 | 109.66 | | 50 day SMA | 107.78 | 107.04 | 106.37 | | 100 day SMA | 91.05 | 90.62 | 90.22 | | 150 day SMA | 86.69 | 86.51 | 86.35 | | 200 day SMA | 87.8 | 87.75 | 87.66 |
|
|
