TegnaInc GCI full analysis,charts,indicators,moving averages,SMA,DMA,EMA,ADX,MACD,RSITegna Inc GCI WideScreen charts, DMA,SMA,EMA technical analysis, forecast prediction, by indicators ADX,MACD,RSI,CCI NYSE stock exchange
operates under Consumer Services sector & deals in Newspapers Magazines
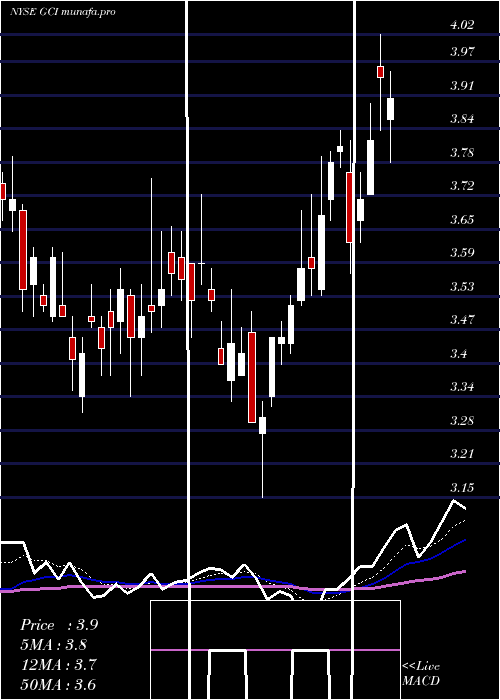
Daily price and charts and targets TegnaInc Strong Daily Stock price targets for TegnaInc GCI are 5.02 and 5.23 | Daily Target 1 | 4.86 | | Daily Target 2 | 4.97 | | Daily Target 3 | 5.07 | | Daily Target 4 | 5.18 | | Daily Target 5 | 5.28 |
Daily price and volume Tegna Inc
| Date |
Closing |
Open |
Range |
Volume |
Fri 07 November 2025 |
5.08 (0.79%) |
5.02 |
4.96 - 5.17 |
0.7359 times |
Thu 06 November 2025 |
5.04 (-1.18%) |
5.11 |
5.01 - 5.18 |
0.4185 times |
Wed 05 November 2025 |
5.10 (0.2%) |
5.14 |
5.02 - 5.23 |
0.5154 times |
Tue 04 November 2025 |
5.09 (-3.96%) |
5.25 |
5.02 - 5.28 |
0.6144 times |
Fri 31 October 2025 |
5.30 (0%) |
5.17 |
5.07 - 5.58 |
0.9812 times |
Fri 31 October 2025 |
5.30 (0.95%) |
5.17 |
5.07 - 5.58 |
0.9812 times |
Thu 30 October 2025 |
5.25 (27.74%) |
3.97 |
3.74 - 5.31 |
3.2429 times |
Wed 29 October 2025 |
4.11 (0.98%) |
4.01 |
3.97 - 4.21 |
0.9925 times |
Tue 28 October 2025 |
4.07 (10.6%) |
3.65 |
3.65 - 4.38 |
1.2662 times |
Mon 27 October 2025 |
3.68 (-2.39%) |
3.79 |
3.66 - 3.81 |
0.2519 times |
Fri 24 October 2025 |
3.77 (0%) |
3.80 |
3.73 - 3.87 |
0.2207 times |
Weekly price and charts TegnaInc Strong weekly Stock price targets for TegnaInc GCI are 4.86 and 5.18 | Weekly Target 1 | 4.79 | | Weekly Target 2 | 4.93 | | Weekly Target 3 | 5.1066666666667 | | Weekly Target 4 | 5.25 | | Weekly Target 5 | 5.43 |
Weekly price and volumes for Tegna Inc
| Date |
Closing |
Open |
Range |
Volume |
Fri 07 November 2025 |
5.08 (-4.15%) |
5.25 |
4.96 - 5.28 |
1.1986 times |
Fri 31 October 2025 |
5.30 (0%) |
5.17 |
5.07 - 5.58 |
0.5149 times |
Fri 31 October 2025 |
5.30 (40.58%) |
3.79 |
3.65 - 5.58 |
3.534 times |
Fri 24 October 2025 |
3.77 (5.9%) |
3.60 |
3.52 - 3.87 |
0.5971 times |
Fri 17 October 2025 |
3.56 (1.42%) |
3.57 |
3.42 - 3.83 |
0.8761 times |
Fri 10 October 2025 |
3.51 (-15.63%) |
4.18 |
3.50 - 4.20 |
0.9368 times |
Fri 03 October 2025 |
4.16 (-1.89%) |
4.26 |
4.06 - 4.27 |
0.5737 times |
Fri 26 September 2025 |
4.24 (-1.4%) |
4.23 |
4.16 - 4.43 |
0.499 times |
Fri 19 September 2025 |
4.30 (1.65%) |
4.25 |
4.20 - 4.45 |
0.8361 times |
Fri 12 September 2025 |
4.23 (-1.4%) |
4.31 |
4.02 - 4.32 |
0.4336 times |
Fri 05 September 2025 |
4.29 (4.38%) |
4.05 |
4.00 - 4.30 |
0.5422 times |
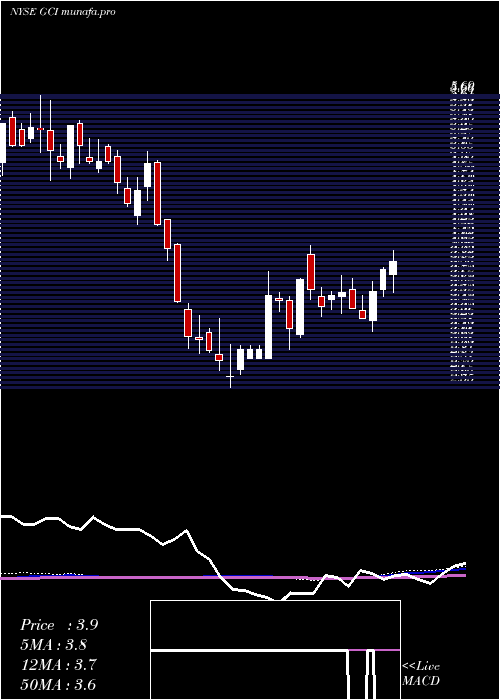
Monthly price and charts TegnaInc Strong monthly Stock price targets for TegnaInc GCI are 4.86 and 5.18 | Monthly Target 1 | 4.79 | | Monthly Target 2 | 4.93 | | Monthly Target 3 | 5.1066666666667 | | Monthly Target 4 | 5.25 | | Monthly Target 5 | 5.43 |
Monthly price and volumes Tegna Inc
| Date |
Closing |
Open |
Range |
Volume |
Fri 07 November 2025 |
5.08 (-4.15%) |
5.25 |
4.96 - 5.28 |
0.3205 times |
Fri 31 October 2025 |
5.30 (28.33%) |
4.09 |
3.42 - 5.58 |
1.8064 times |
Tue 30 September 2025 |
4.13 (0.49%) |
4.05 |
4.00 - 4.45 |
0.6924 times |
Fri 29 August 2025 |
4.11 (7.87%) |
3.73 |
3.66 - 4.34 |
1.0879 times |
Thu 31 July 2025 |
3.81 (6.42%) |
3.54 |
3.51 - 4.17 |
1.1562 times |
Mon 30 June 2025 |
3.58 (1.13%) |
3.53 |
3.15 - 3.75 |
1.0175 times |
Fri 30 May 2025 |
3.54 (10.63%) |
3.20 |
2.96 - 4.07 |
1.0181 times |
Wed 30 April 2025 |
3.20 (10.73%) |
2.89 |
2.55 - 3.79 |
1.302 times |
Mon 31 March 2025 |
2.89 (-28.47%) |
4.08 |
2.87 - 4.09 |
0.9069 times |
Fri 28 February 2025 |
4.04 (-10.62%) |
4.40 |
3.91 - 5.08 |
0.692 times |
Fri 31 January 2025 |
4.52 (-10.67%) |
5.11 |
4.49 - 5.42 |
0.6421 times |

DMA SMA EMA moving averages of Tegna Inc GCI
DMA (daily moving average) of Tegna Inc GCI
| DMA period | DMA value | | 5 day DMA | 5.12 | | 12 day DMA | 4.63 | | 20 day DMA | 4.22 | | 35 day DMA | 4.16 | | 50 day DMA | 4.18 | | 100 day DMA | 4.01 | | 150 day DMA | 3.79 | | 200 day DMA | 3.81 | EMA (exponential moving average) of Tegna Inc GCI
| EMA period | EMA current | EMA prev | EMA prev2 | | 5 day EMA | 5.03 | 5.01 | 5 | | 12 day EMA | 4.72 | 4.66 | 4.59 | | 20 day EMA | 4.5 | 4.44 | 4.38 | | 35 day EMA | 4.32 | 4.28 | 4.24 | | 50 day EMA | 4.27 | 4.24 | 4.21 |
SMA (simple moving average) of Tegna Inc GCI
| SMA period | SMA current | SMA prev | SMA prev2 | | 5 day SMA | 5.12 | 5.17 | 5.21 | | 12 day SMA | 4.63 | 4.52 | 4.4 | | 20 day SMA | 4.22 | 4.15 | 4.08 | | 35 day SMA | 4.16 | 4.14 | 4.12 | | 50 day SMA | 4.18 | 4.16 | 4.14 | | 100 day SMA | 4.01 | 3.99 | 3.97 | | 150 day SMA | 3.79 | 3.77 | 3.76 | | 200 day SMA | 3.81 | 3.81 | 3.81 |
|
|
